Google Trends makes keyword research more grounded by showing whether interest in a query is rising, falling, or seasonal across regions and Google surfaces.
That said, it’s not a search volume tool, so you don’t use it to predict traffic. Instead, you use it to validate direction, timing, and demand shifts.
In this guide, I’ll show you how to read Trends properly, then walk through a step-by-step workflow to expand keywords, compare variants, localize targets, and prioritise what to create next.
What Is Google Trends?
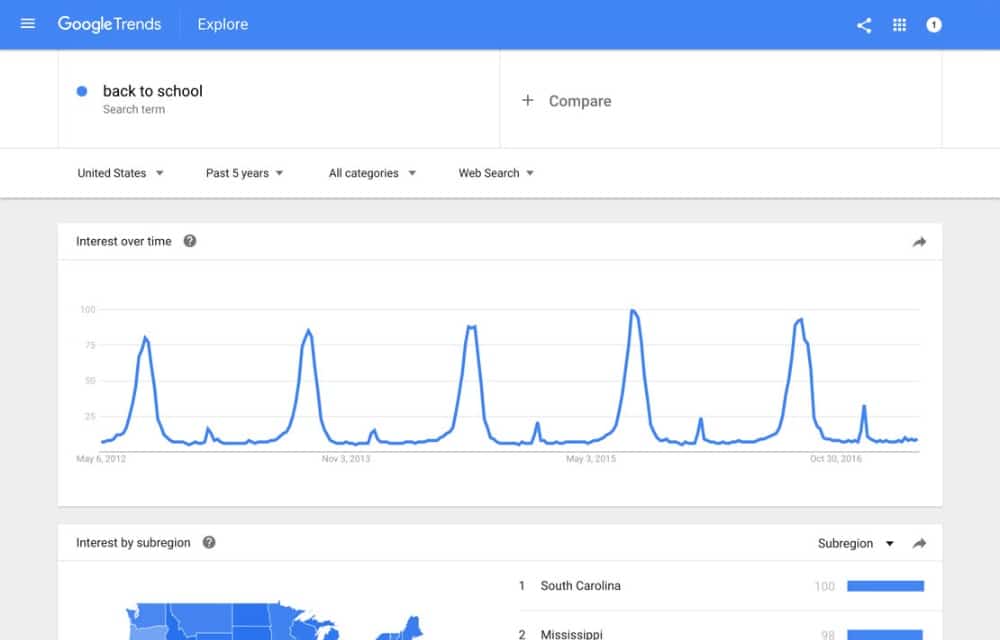
Google Trends is a free, public web tool provided by Google that analyzes the popularity of search queries across Google Search, YouTube, News, and Shopping, providing real-time and historical data (since 2004).
It helps users visualize search interest, compare keyword popularity, and identify trending topics by region, time, and category.
What Google Trends Data Actually Represents?
Google Trends data represents a normalized, sampled, and anonymized index of search interest rather than the absolute volume of searches.
It provides insight into the relative popularity of a topic, keyword, or entity compared to the total search volume on Google across different regions and timeframes.
Here is a detailed breakdown of what Google Trends data actually represents:
1. Relative Popularity (0–100 Scale)
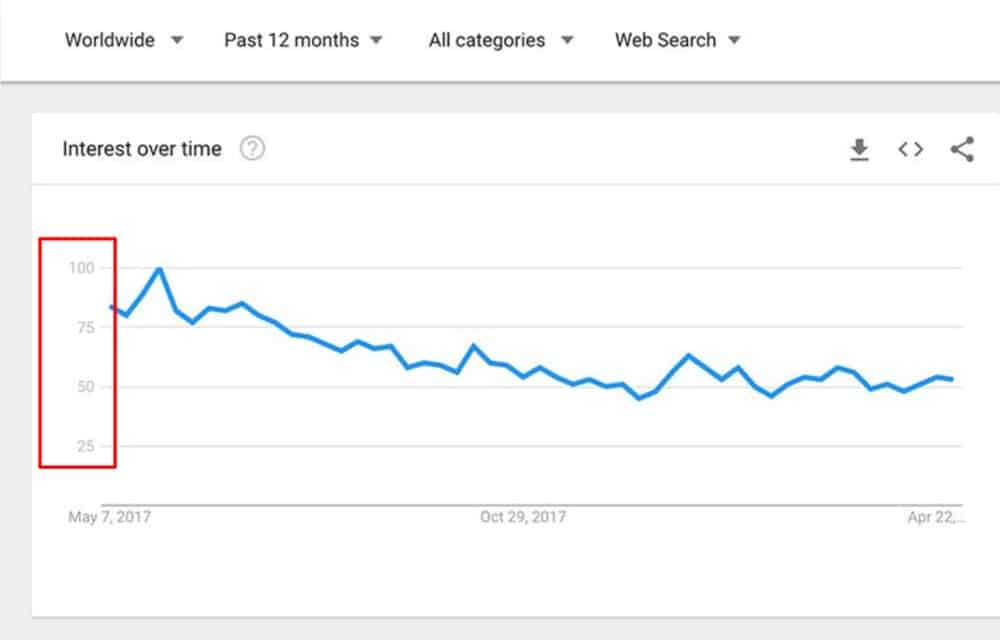
Google Trends does not show that a topic was searched for, for example, 1 million times.
Instead, it normalizes the data to a scale of 0 to 100, where 100 represents the peak popularity at the selected time and location.
- 100: The peak popularity for the term.
- 50: The term is half as popular.
- 0: There was not enough data for this term, or it had very low search volume.
2. A Sample of Search Data
Google handles billions of searches daily. To make data accessible and fast, Trends uses a sample rather than the entire dataset.
This sample is considered highly representative of total search activity. And because it is a sample, numbers may change slightly over time.
3. Normalization by Region and Time
Data is normalized to facilitate comparisons. Each data point is divided by the total searches in that specific geography and time range.
As a result, a smaller, less populated area with high interest in a topic (e.g., a city where a sports team is based) can show a value of 100, while a larger area with lower, more diverse interest will show a lower value.
4. Search Interest vs. True Popularity
Google Trends measures curiosity, not necessarily popularity or sentiment. A spike in a topic could indicate a news event, a scandal, or a technical issue rather than genuine, positive interest.
5. What does Breakout Mean on Google Trends?
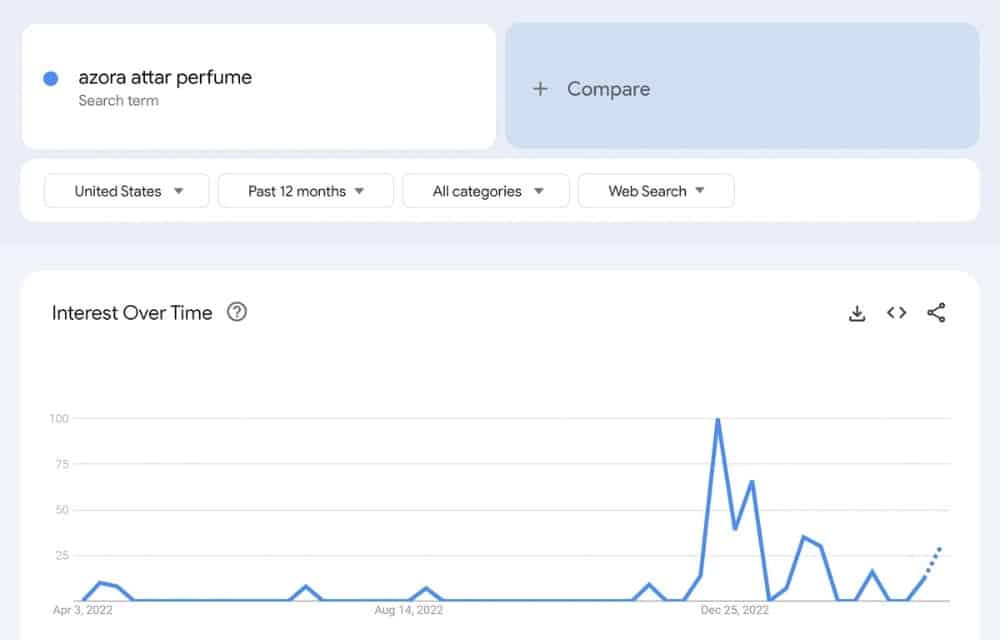
A “Breakout” on Google Trends indicates that a search term has experienced a massive, sudden surge in popularity, rising by over 5,000% compared to the previous period.
It indicates a topic has moved from very low or zero search volume to a significant level, often highlighting emerging trends, viral topics, or, occasionally, technical data shifts.
Such terms appear in “Related Queries” or “Related Topics” when sorting by “Rising”.
What is Filtered Out?
To provide cleaner data, Google Trends filters out:
- Searches made by very few people: Low-volume searches appear as ‘0’.
- Duplicate searches: Repeated searches from the same user over a short period are removed.
- Special characters: Queries with apostrophes or other special characters are filtered out.
Where Google Trends Data Comes From
Google Trends data is derived from a filtered, anonymized, and aggregated sample of actual, real-time search queries entered into Google Search, YouTube, Google News, and Google Shopping. It is NOT a complete log of every query.
It provides a representative index of relative search popularity (0–100) rather than exact, absolute search volumes, enabling analysis of interest trends over time and across regions.
This sampling approach also explains why some keywords barely show data. If a term has very low or inconsistent search activity, Google may not surface a meaningful trend at all.
When I see that happen, I don’t try to force it. Either the topic is too niche right now, or demand hasn’t matured enough to justify a serious SEO investment.
How Google Normalizes and Adjusts Trend Data
Normalization is what makes Google Trends both powerful and dangerous.
Google adjusts search data based on total search volume in a region and timeframe, then scales it from 0 to 100.
That’s why numbers only make sense inside the same chart.
In practice, this means I never compare screenshots from different searches.
If I want to evaluate two keyword ideas, I put them into the same comparison view so they’re normalized against the same baseline.
Outside of that context, the values don’t tell you much.
This is also why Google Trends should never be treated like a volume tool.
It’s built for comparison and direction, not precision.
How Google Trends Works (So You Don’t Misread the Data)
Search Terms vs Topics in Google Trends
This is one of the first things I explain to junior SEOs because it trips people up constantly. A search term is exactly what it sounds like: the literal phrase someone types into Google.
A topic, on the other hand, groups related searches that share the same intent, even if the wording differs.
When I’m researching something broad or ambiguous, I almost always start with topics because they give a cleaner picture of overall demand.
The mistake I see most often is sticking with search terms out of habit.
That works fine for very specific phrases, but it can seriously underreport interest when users search in multiple ways.
I’ve seen people dismiss good opportunities simply because they chose the term option and missed half the demand that would have shown up under a topic.
Understanding Search Types in Google Trends
Most people leave Google Trends set to Web Search and never touch the other options.
That’s fine for blog content and standard SEO pages, but it’s limiting if you’re working outside that box.
Different search types matter in different situations:
- Image Search matters for visual-heavy niches like fashion or home decor
- YouTube Search is critical if video plays a role in your strategy
- Shopping Search becomes relevant when product discovery is part of the funnel
I switch search types based on intent, not curiosity.
If I’m helping a client grow a YouTube channel, Web Search trends don’t tell me much.
The same keyword can behave very differently depending on where users are searching, and ignoring that context leads to bad assumptions.
Using Location and Time Filters Correctly
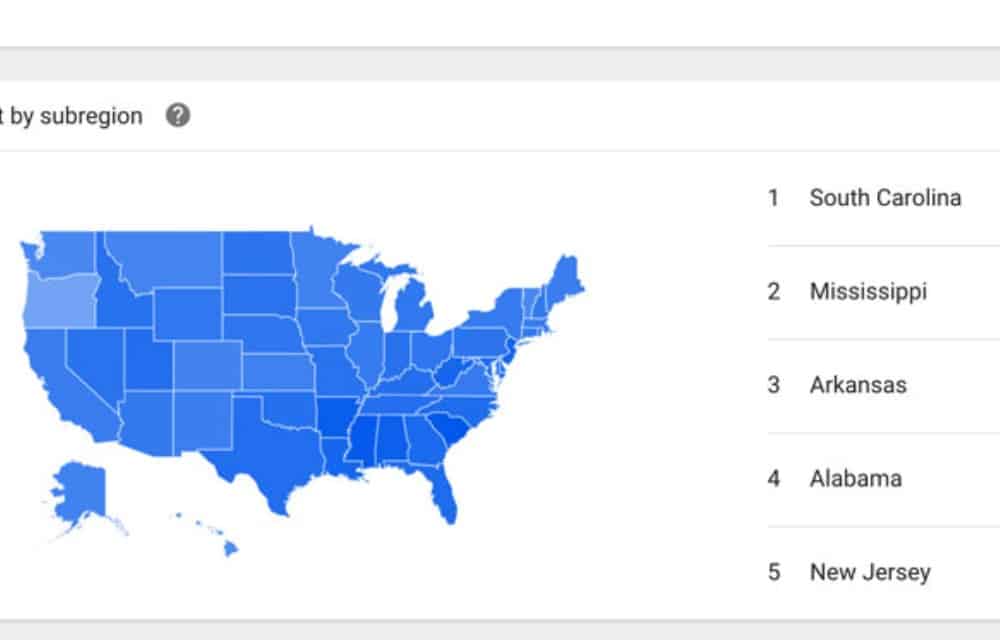
Geography changes everything.
A keyword that looks dead at the national level might be surging in a specific state or city. Google Trends makes it clear when demand is concentrated in one area rather than evenly spread.
Time range is just as important. A five-year view shows stability and long-term direction, while a 90-day view highlights momentum.
When I’m planning seasonal content, I zoom out to spot patterns, then zoom in to see exactly when interest starts climbing.
That timing difference can be the reason a page ranks early or misses the window entirely.
How to Use Google Trends for SEO Keyword Research
Step 1: Start with a seed keyword, then choose “Topic” when available
Start with one broad seed keyword you already associate with the problem (e.g., “google trends keyword research”). In Google Trends, enter it and select Topic vs Search term.
If Topic is available, use it because it captures the concept across related phrasing and languages, which reduces noisy matches and makes your trend signal more reliable.
Step 2: Set your context with the four key filters
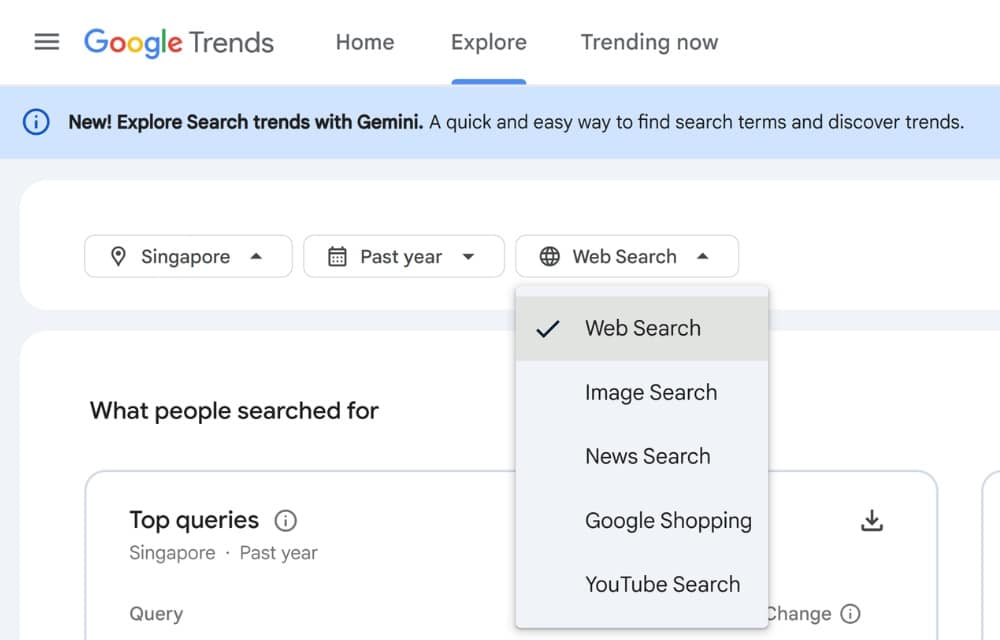
Before you interpret anything, lock in your context: location, time range, category, and search type (Web, News, Shopping, YouTube).
These filters can completely change the meaning of the data, so set them first and keep them consistent across comparisons.
As a rule of thumb, use shorter ranges to validate current momentum, and multi-year ranges to detect seasonality and long-term stability.
Step 3: Read the “Interest over time” chart correctly
Treat the “Interest over time” chart as a direction indicator, not a traffic counter. Google Trends shows relative interest on a normalized scale, so you’re looking for patterns: rising, falling, seasonal spikes, or flat evergreen demand.
Your output from this step should be a simple classification (e.g., “seasonal with Q4 peaks” or “steady year-round”) because that classification determines how you prioritize and plan content.
Step 4: Spot seasonality and plan publishing windows
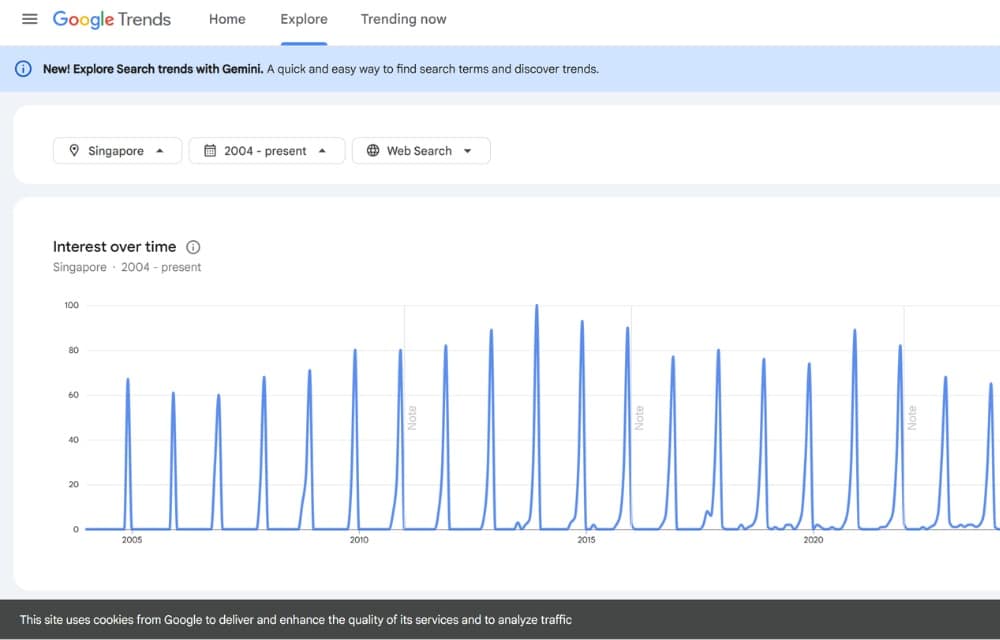
Switch your time range to a multi-year view and look for repeatable peaks and troughs that show predictable demand cycles.
If you see consistent spikes, you’re not just picking a keyword but a publishing window, because seasonal topics need lead time to rank before the peak hits. Capture the “when” alongside the keyword so your editorial calendar aligns with how people actually search.
Step 5: Mine “Related topics” and “Related queries” for keyword expansion
Scroll to Related topics and Related queries and use them as your primary expansion engine. “Top” lists what’s consistently popular; “Rising” surfaces what’s gaining momentum.
Pull candidates from both, because Top terms give you stable targets, while Rising terms help you identify emerging angles, fresh subtopics, and long-tail phrasing you may not have considered.
Step 6: Treat “Breakout” terms as high-signal, then sanity-check them
When you see “Breakout” in Rising, treat it as a high-signal alert that interest has surged dramatically.
That’s valuable, but it also increases the risk of chasing a short-lived spike, a news event, or a trend that won’t convert.
Add breakout terms to a shortlist, then validate them with real-world context (what changed, why people care, and whether the intent matches your audience) before you build content around them.
Step 7: Compare keywords to pick the better target and the better angle
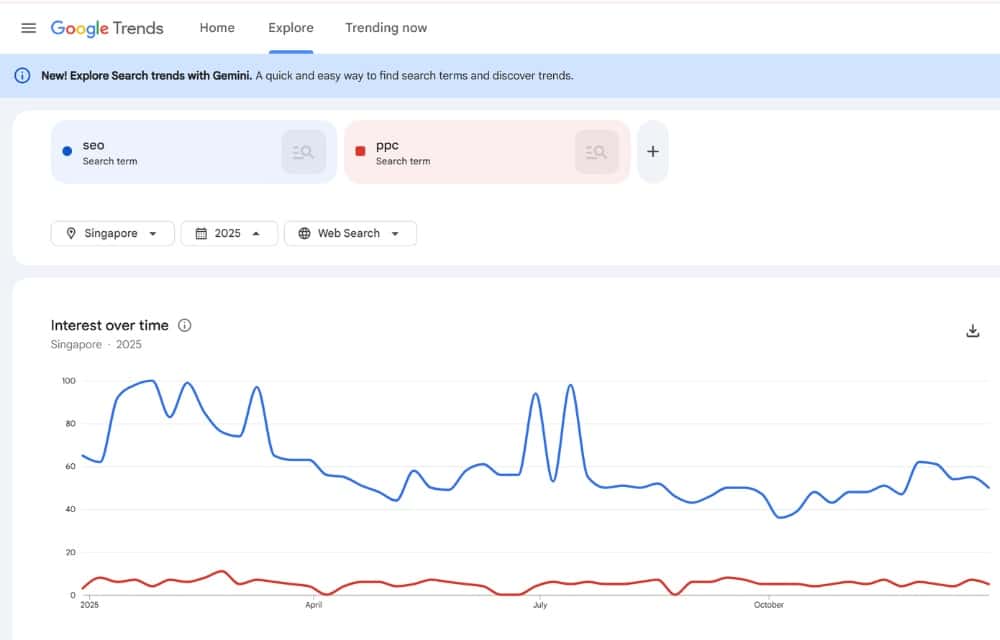
Use the Compare feature to evaluate close variants and clarify which phrasing has stronger momentum within the same filters.
This helps you choose not only the best primary keyword, but also the best framing (e.g., “how to,” “best,” “vs,” “near me”) based on what people actually search.
If one variant trends upward while another stays flat, that’s often a signal that language preferences or intent are shifting.
Step 8: Use “Interest by subregion” to localize keywords and content
Check Interest by subregion to see where demand is concentrated and how it differs by region.
This is useful for localization: you can adapt examples, FAQs, comparisons, and even keyword modifiers to match local behavior. If a topic is disproportionately strong in certain areas, that’s also a hint to create location-specific sections or pages—only when it genuinely improves usefulness.
Step 9: Build a final keyword set, then map each keyword to intent and format
Turn your findings into a keyword set that’s organized by intent, not just by volume or trend shape.
Group terms into clusters like definitions, how-tos, comparisons, and “best” lists, then assign the best content format for each (guide, checklist, template, video, FAQ).
This step is where Trends becomes SEO output: you’re translating patterns into a structure that searchers can scan, trust, and act on.
Step 10: Export findings and document decisions for repeatability
Export your shortlist (or record it in a sheet) and document the settings used: location, timeframe, search type, and the trend classification you assigned.
Add quick notes on why you chose each target, what angle you’ll take, and when you plan to publish if seasonality exists. This makes your process repeatable, easier to review, and more defensible when stakeholders ask “why this keyword?”
Combining Google Trends with Other Keyword Research Tools
Google Trends works best as a filter, not a foundation. I use it to narrow down ideas, then validate those ideas with volume data from traditional keyword tools.
Google Trends tells me where interest is headed, while volume tools help me understand current demand. Together, they reduce guesswork.
I also cross-check promising keywords against Google Search Console data when possible.
If a site already shows impressions for related queries, Trends helps me decide which ones deserve optimization first.
That combination gives me confidence because I’m aligning historical performance with future demand instead of relying on a single signal.
Common Google Trends Mistakes That Hurt SEO
The biggest mistake I see is treating Google Trends like a volume estimator. It’s not built for that, and using it that way leads to bad decisions.
Another common issue is overreacting to short-term spikes. A sudden jump looks exciting, but without context, it often fades just as fast.
I’ve also seen people:
- Compare unrelated keywords
- Ignore intent altogether
Just because two terms trend similarly doesn’t mean they solve the same problem for users. The fix is simple but disciplined.
Compare only related terms, zoom out before reacting, and always sanity-check trends against real search intent.
When Google Trends Is Useful (And When It’s Not)
Google Trends shines when you need direction.
It’s ideal for spotting seasonality, comparing keyword variations, validating timing, and understanding regional differences.
I rely on it most when planning content calendars and deciding which ideas deserve early investment.
Where it falls short is precision. It’s not helpful for estimating traffic, evaluating very low-volume niches, or replacing full keyword research workflows.
Once you accept those limits, expectations remain realistic, and the tool becomes far more valuable than frustrating.
A Practical Google Trends Keyword Research Workflow
FAQs About Google Trends and Keyword Research
What Does Breakout Mean on Google Trends?
“Breakout” means a search term is seeing explosive growth compared to its previous baseline.
Google uses that label when growth is so high that assigning a clean percentage wouldn’t be accurate.
In plain terms, interest is accelerating fast, often because the topic is new or suddenly relevant.
I pay attention to breakout terms when they align closely with a site’s focus and when I can act quickly.
They’re worth pursuing if the intent makes sense and the topic has room to mature.
If it’s pure hype with no lasting value, I usually pass.
Can Google Trends Replace Keyword Research Tools?
It can’t, and it was never meant to.
Google Trends doesn’t show search volume, competition, or ranking difficulty, which are still critical for planning SEO work.
What it does better than traditional tools is reveal timing, momentum, and relative interest.
I use Trends alongside volume tools, not instead of them. Search volume tells me what’s popular now. Trends tells me where interest is heading.
Together, they create a much clearer picture than either one alone.
Why Does Google Trends Show Different Results for the Same Keyword?
Filters change everything. Time range, location, and search type all affect how Trends normalizes data, so the same keyword can look very different depending on those settings.
That’s not an error, it’s context.
To avoid confusion, I keep comparisons within the same chart and double-check filters before drawing conclusions.
Once you treat Trends as a relative tool instead of an absolute one, those differences start to make sense.
Make Google Trends Your SEO Compass, Not Your Calculator
I’ve learned to use Google Trends as a validator, not a crystal ball. Its real value is direction and comparison, helping you decide whether a keyword is gaining momentum, fading out, or peaking seasonally.
And if you want help turning those signals into an SEO plan that actually drives revenue, First Page Digital Singapore can help you execute it with a data-led approach that’s built for long-term growth.
Sign up for a FREE digital strategy call worth $2,000 today!