If you’ve been working on technical SEO for a while, you’ll realize that at its core, Core Web Vitals is about fixing how your site actually feels to users.
When clients ask me for a proper breakdown of core web vitals, I usually start with the basics:
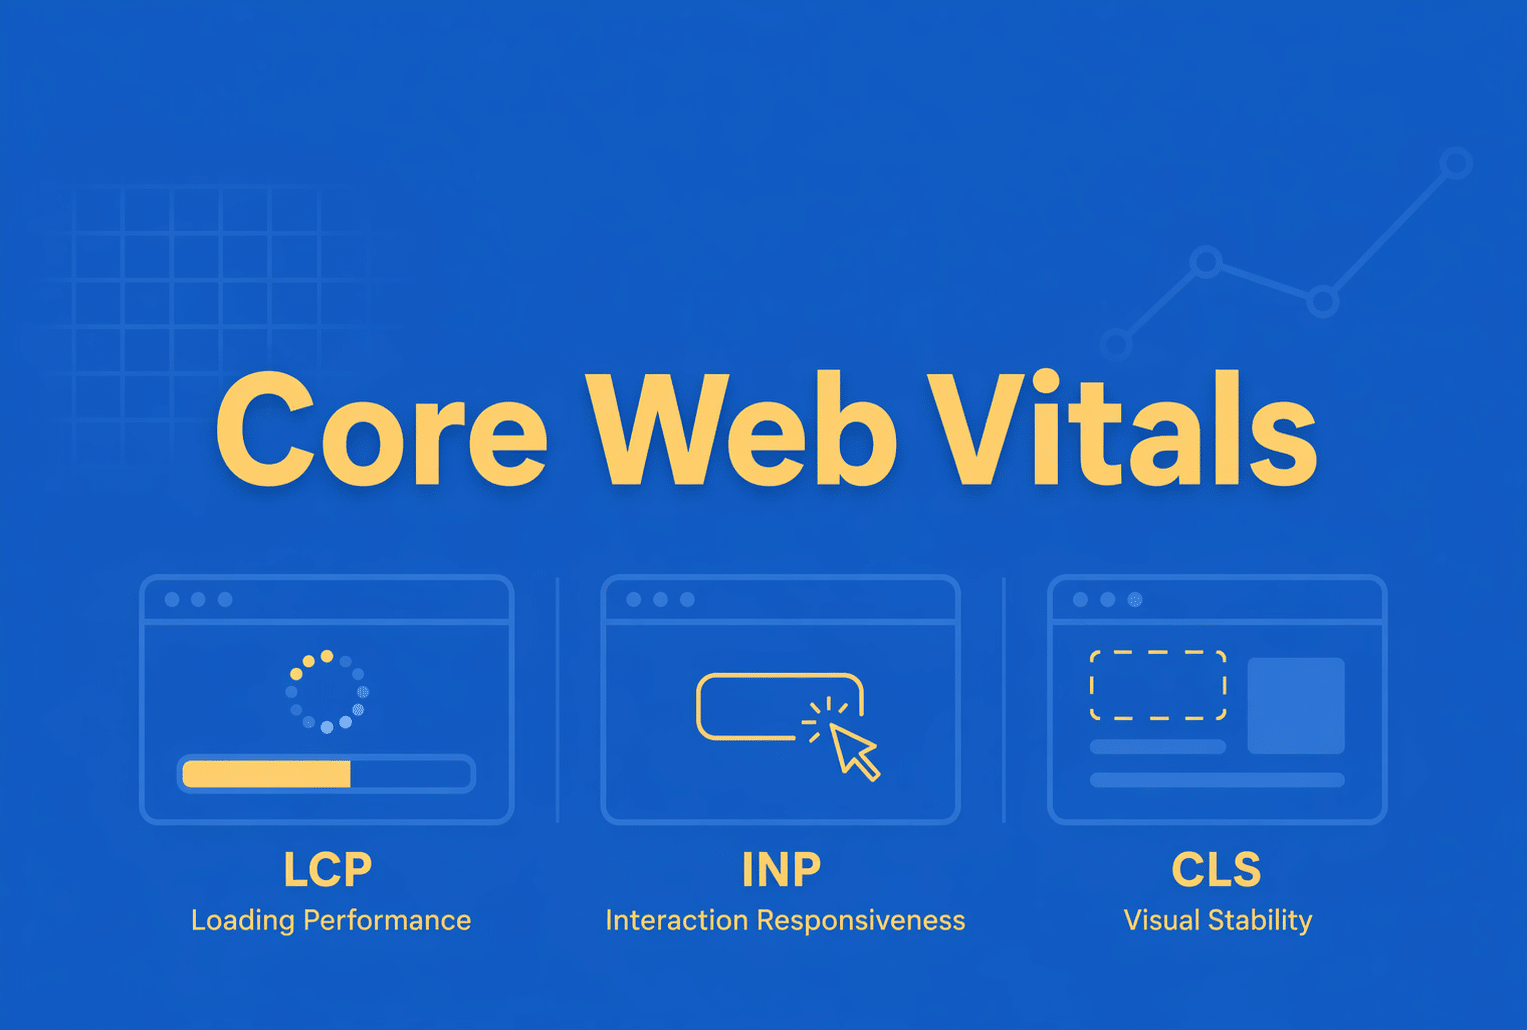
- How fast your main content loads (LCP)
- How quickly your site responds when someone interacts (INP, which replaced FID)
- How stable your layout is while everything loads (CLS)
These metrics go beyond traditional core web vitals, page speed, and directly tie into how Google evaluates real user experience.
In this guide, I’ll walk through what the core web vitals are, how they influence rankings, and how to optimize them based on what I’ve seen work across real audits and projects.
What Are the Core Web Vitals?
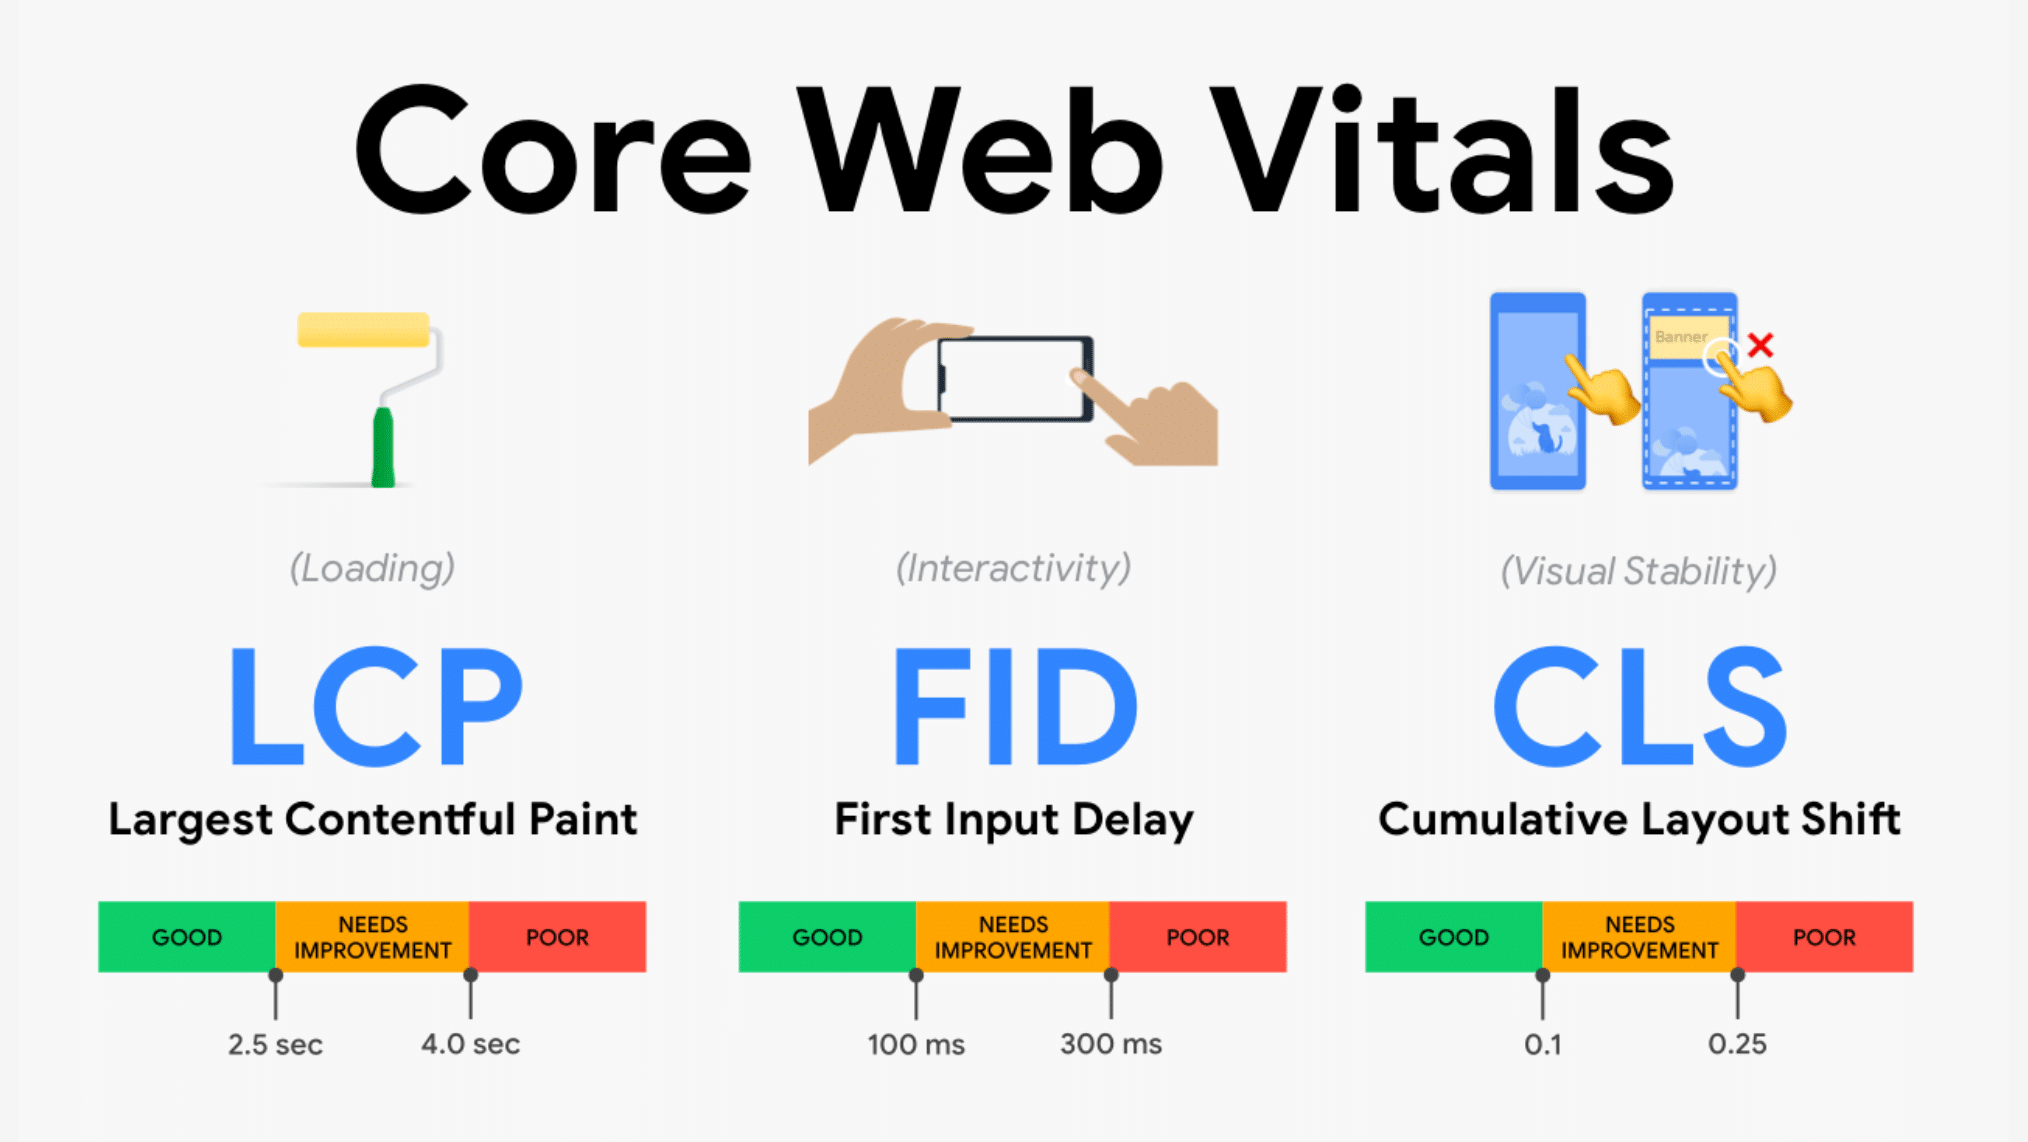
Core Web Vitals are a set of performance metrics defined by Google to measure how users actually experience a webpage in terms of loading, responsiveness, and visual stability. When clients ask me what the core web vitals are, I usually explain it this way: it’s not just about how fast your site loads, but how smooth and usable it feels from the moment someone lands on it to the moment they interact with it.
The Three Core Web Vitals Metrics
The three core web vitals metrics are designed to capture different parts of the user journey: loading performance, interaction responsiveness, and visual stability. Together, they provide a more complete picture of how a site behaves beyond simple core web vitals page speed measurements.
Largest Contentful Paint (LCP)
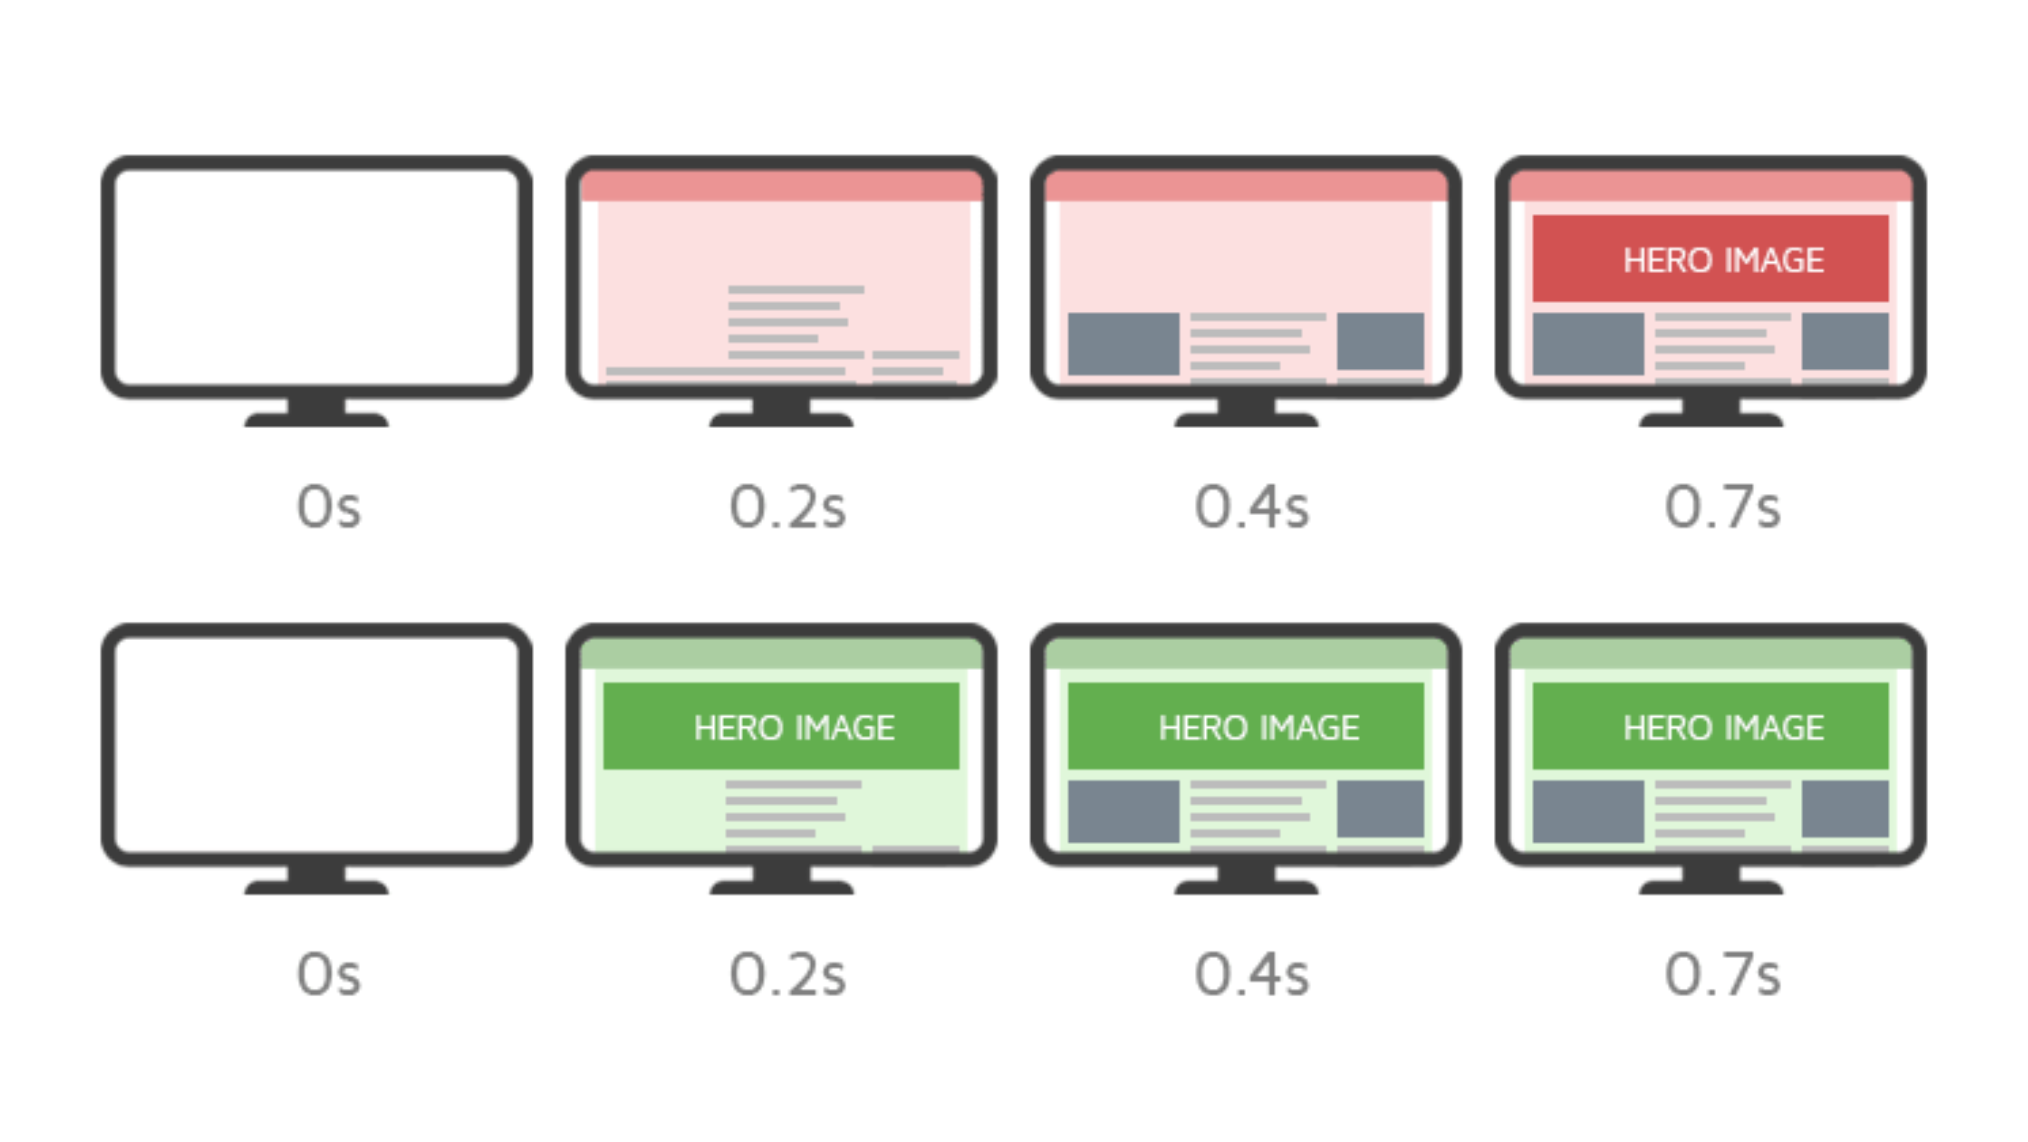
Largest Contentful Paint (LCP) measures how long it takes for the main visible content of a page to load, typically the largest image or heading within the viewport. A slow LCP often signals issues with server response time, render-blocking resources, or unoptimized images, which directly affect first impressions.
Interaction to Next Paint (INP)
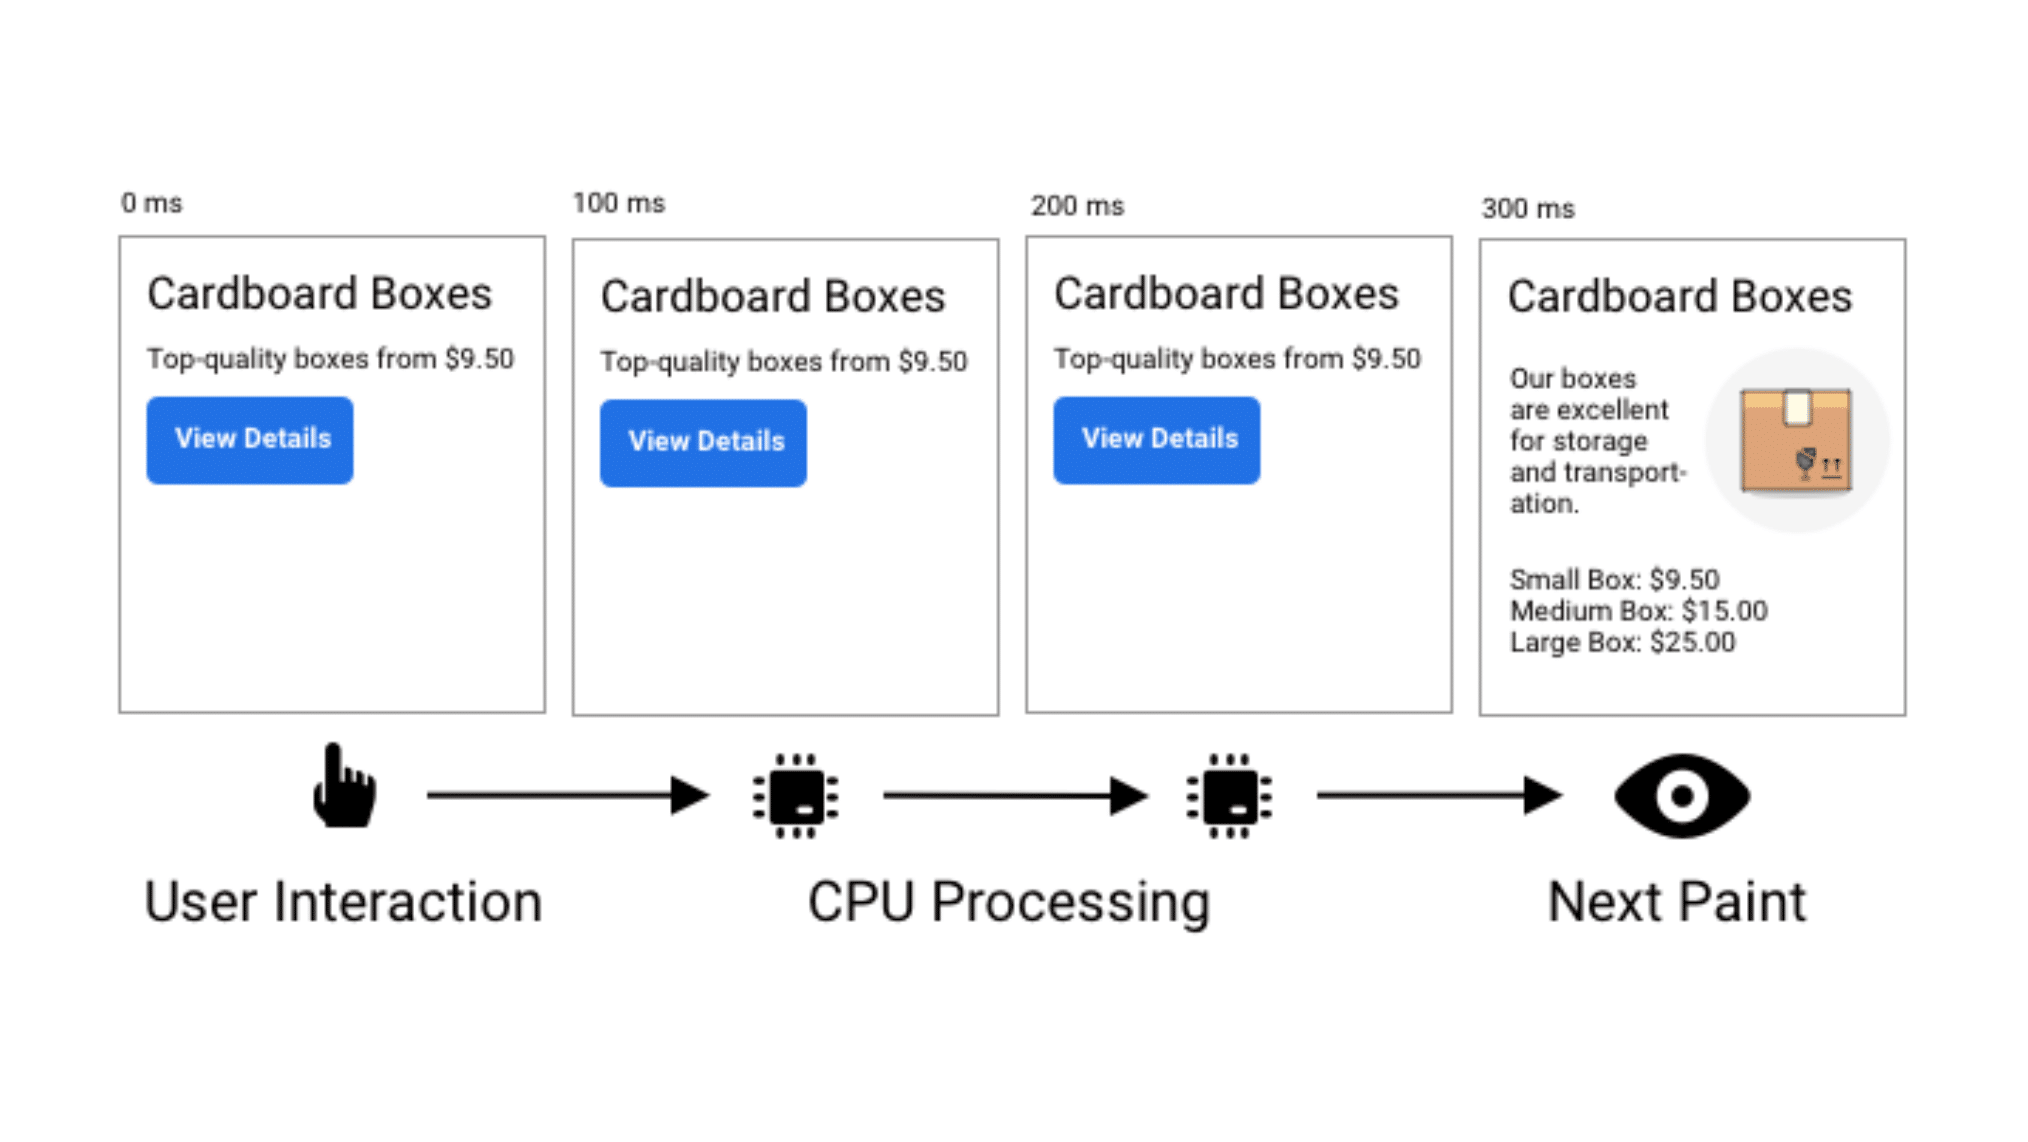
The Interaction to Next Paint (INP) metric measures how quickly a page responds after a user interacts with it, such as clicking a button or submitting a form.
It replaced First Input Delay (FID) because FID captured only the first interaction, whereas INP reflects responsiveness across the entire user session, providing a more accurate view of real-world usability.
Cumulative Layout Shift (CLS)
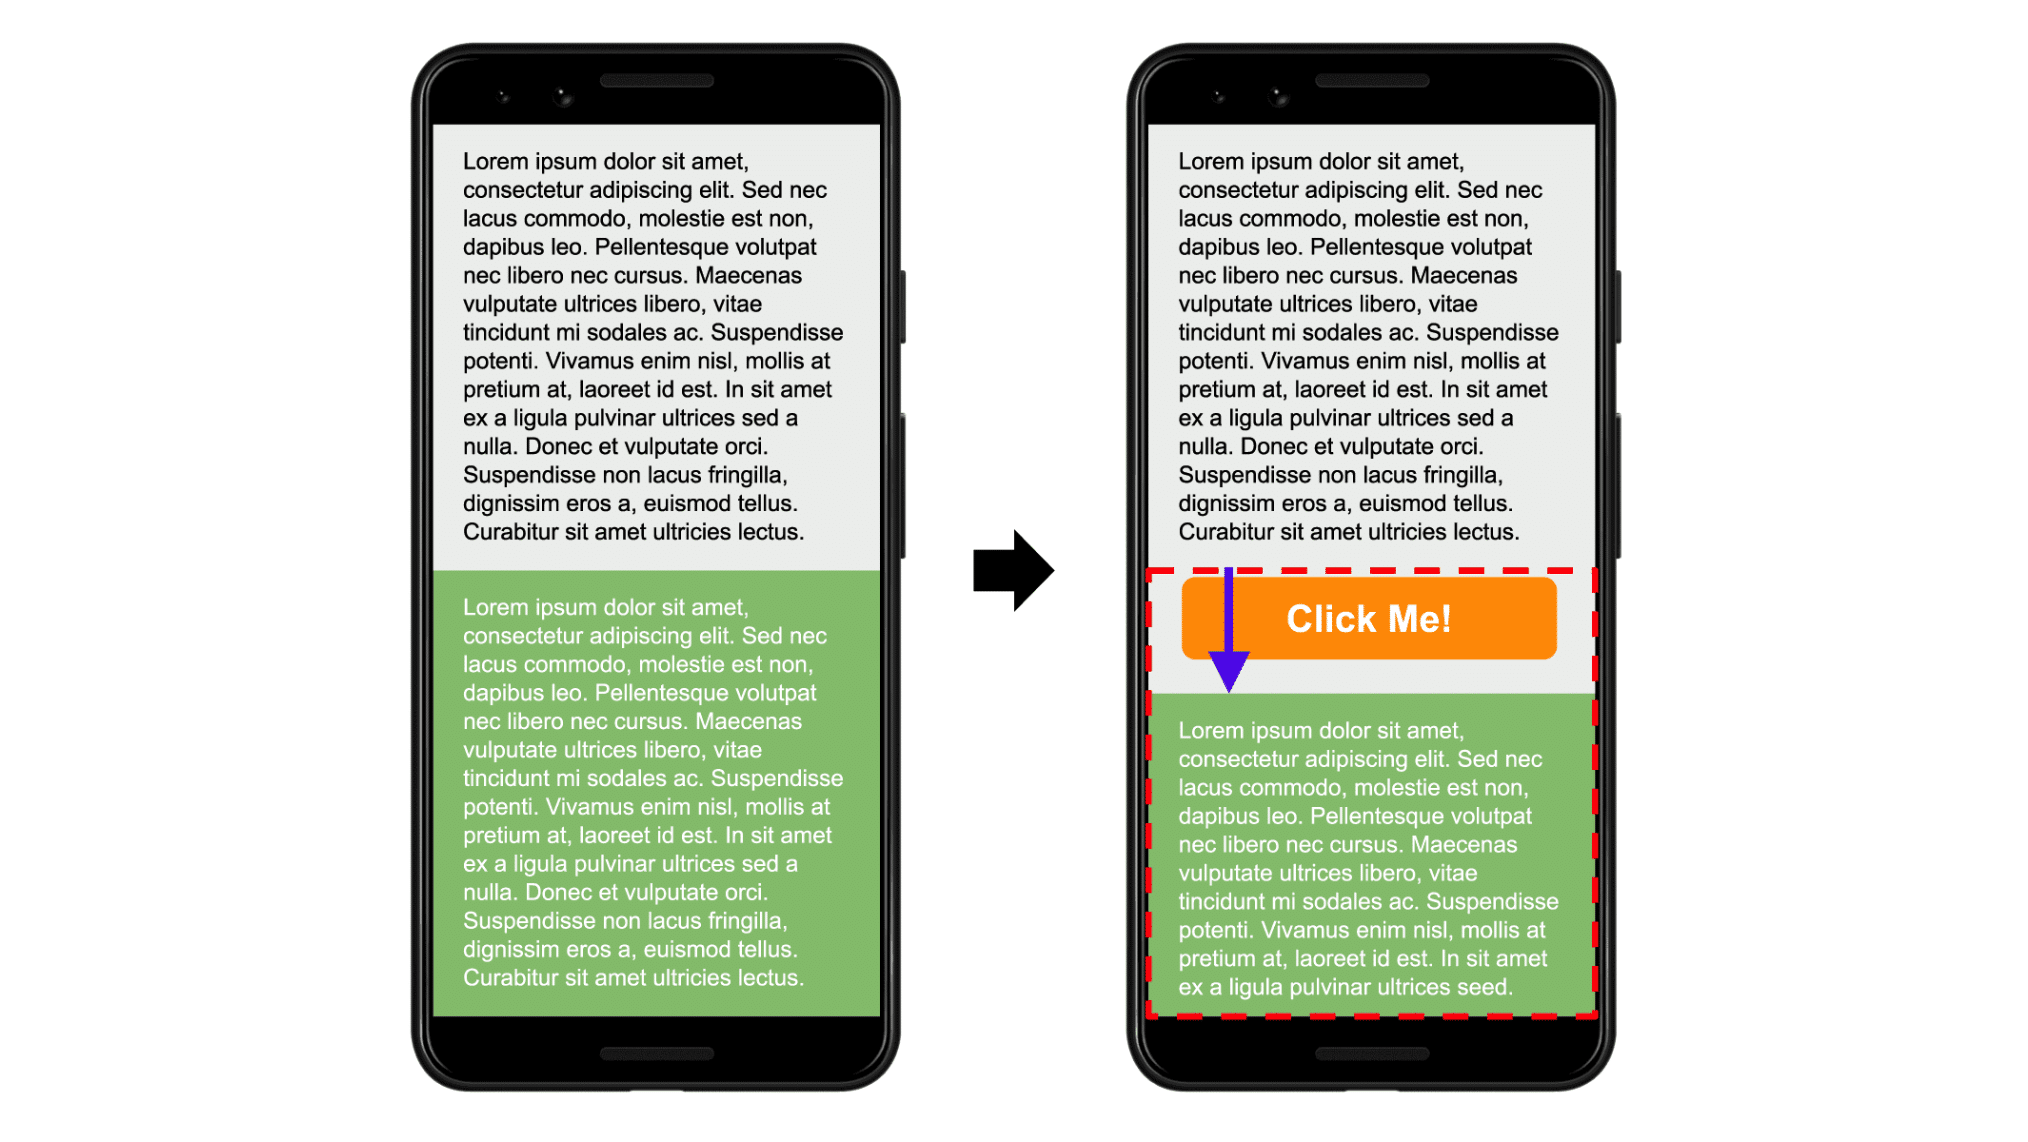
Cumulative Layout Shift (CLS) measures how stable a page’s layout is while it loads and during interaction. When elements suddenly move, like buttons shifting or text jumping, it creates a frustrating experience, especially on mobile, where accidental clicks happen easily.
How Page Speed Relates to Core Web Vitals Metrics
Page speed and Core Web Vitals are closely related, but they are not the same thing. Page speed focuses on how quickly a page loads, while Core Web Vitals measure how that page behaves after loading, including responsiveness and stability.
In real-world optimization work, I treat page speed as the entry point and Core Web Vitals as the full experience. You can improve load time and still have poor responsiveness if JavaScript blocks interactions. That’s why when clients ask how to optimize core web vitals, I always emphasize that speed alone isn’t enough — usability during interaction matters just as much.
How Do Core Web Vitals Affect SEO?
Core Web Vitals affect SEO by contributing to Google’s page experience signals, which evaluate how usable and responsive your website feels to real users.
When clients ask me how Core Web Vitals affect SEO, I usually explain that they don’t replace content quality, but they influence how competitive your pages are when everything else is equal.
Are Core Web Vitals a Ranking Factor?
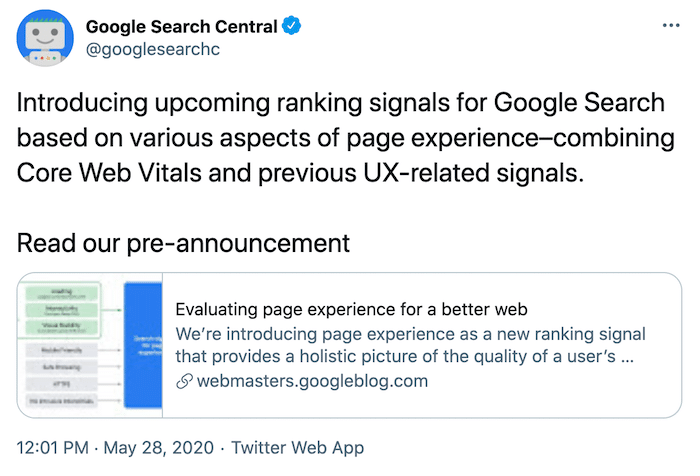
Yes, Core Web Vitals are a ranking factor in Google Search as part of the page experience system. Google has publicly confirmed that metrics like loading speed, responsiveness, and layout stability directly contribute to how pages are evaluated in search results.
From my experience, this doesn’t mean improving Core Web Vitals alone will push a page to rank. If your content is weak, no amount of optimization will fix that.
But when two pages are similar in relevance, better performance can give you the edge. That’s where understanding core web vitals, explained in a practical way, becomes useful. It provides a competitive advantage instead of simply being a mere hack.
The Role of Page Experience in Google Search
Page experience acts as a supporting signal that helps Google determine whether users will have a smooth interaction with your site.
It includes Core Web Vitals, along with factors such as mobile usability and HTTPS, all working together to assess overall usability.
In real SEO projects, I treat this as a trust layer. You can attract users with strong content, but if your page feels slow or unstable, users drop off quickly.
That behavior matters. A good core web vitals page speed setup ensures users can access content quickly, while responsiveness and stability keep them engaged long enough to take action.
When Core Web Vitals Actually Impact Rankings
Core Web Vitals impact rankings most noticeably when competing pages have similar content quality and intent alignment. In those situations, performance becomes a deciding factor because Google wants to surface pages that deliver a better experience.
I’ve seen this play out during audits where two pages target the same keyword, but one loads faster and responds instantly while the other lags due to heavy scripts.
Over time, the better-performing page tends to hold stronger positions. That’s why when planning how to optimize Core Web Vitals, I focus on scenarios where performance improvements can directly influence outcomes, not just metrics in a report.
Why Was First Input Delay (FID) Replaced by Interaction to Next Paint (INP)?
First Input Delay (FID) was replaced by Interaction to Next Paint (INP) because FID only measured the delay of the first user interaction, which didn’t reflect a page’s full responsiveness.
In real-world usage, users interact multiple times, so Google introduced INP to better capture how a site behaves across the entire session, not just the first click.
Limitations of First Input Delay (FID)
First Input Delay (FID) was limited because it only measured the delay before the browser could respond to the very first interaction. That meant a page could perform well on paper while still feeling slow during later interactions, especially on pages with heavy JavaScript or dynamic elements.
From my audits, this was a common blind spot. A site might pass Core Web Vitals thresholds in tools like the Google Search Console Core Web Vitals report, but users would still experience lag when opening menus or submitting forms. FID simply didn’t capture those ongoing delays.
How INP Improves Measurement of Responsiveness
Interaction to Next Paint (INP) improves responsiveness measurement by tracking the delays across multiple interactions and reporting the worst-case scenario during a user’s visit. This gives a more realistic view of how responsive a page feels in actual usage, rather than relying on a single moment.
In practice, this shift makes optimization more meaningful. Instead of focusing only on initial load behavior, I now look at how pages respond during real engagement. When clients ask how to optimize Core Web Vitals, improving INP often uncovers deeper performance issues that were previously hidden under FID.
How to Measure Core Web Vitals
You measure Core Web Vitals by combining real user data with controlled testing tools, because each gives a different perspective on performance. In my experience, relying on just one source often leads to misleading conclusions, especially when diagnosing issues that only appear on certain devices or network conditions.
Using Google Search Console Core Web Vitals Report
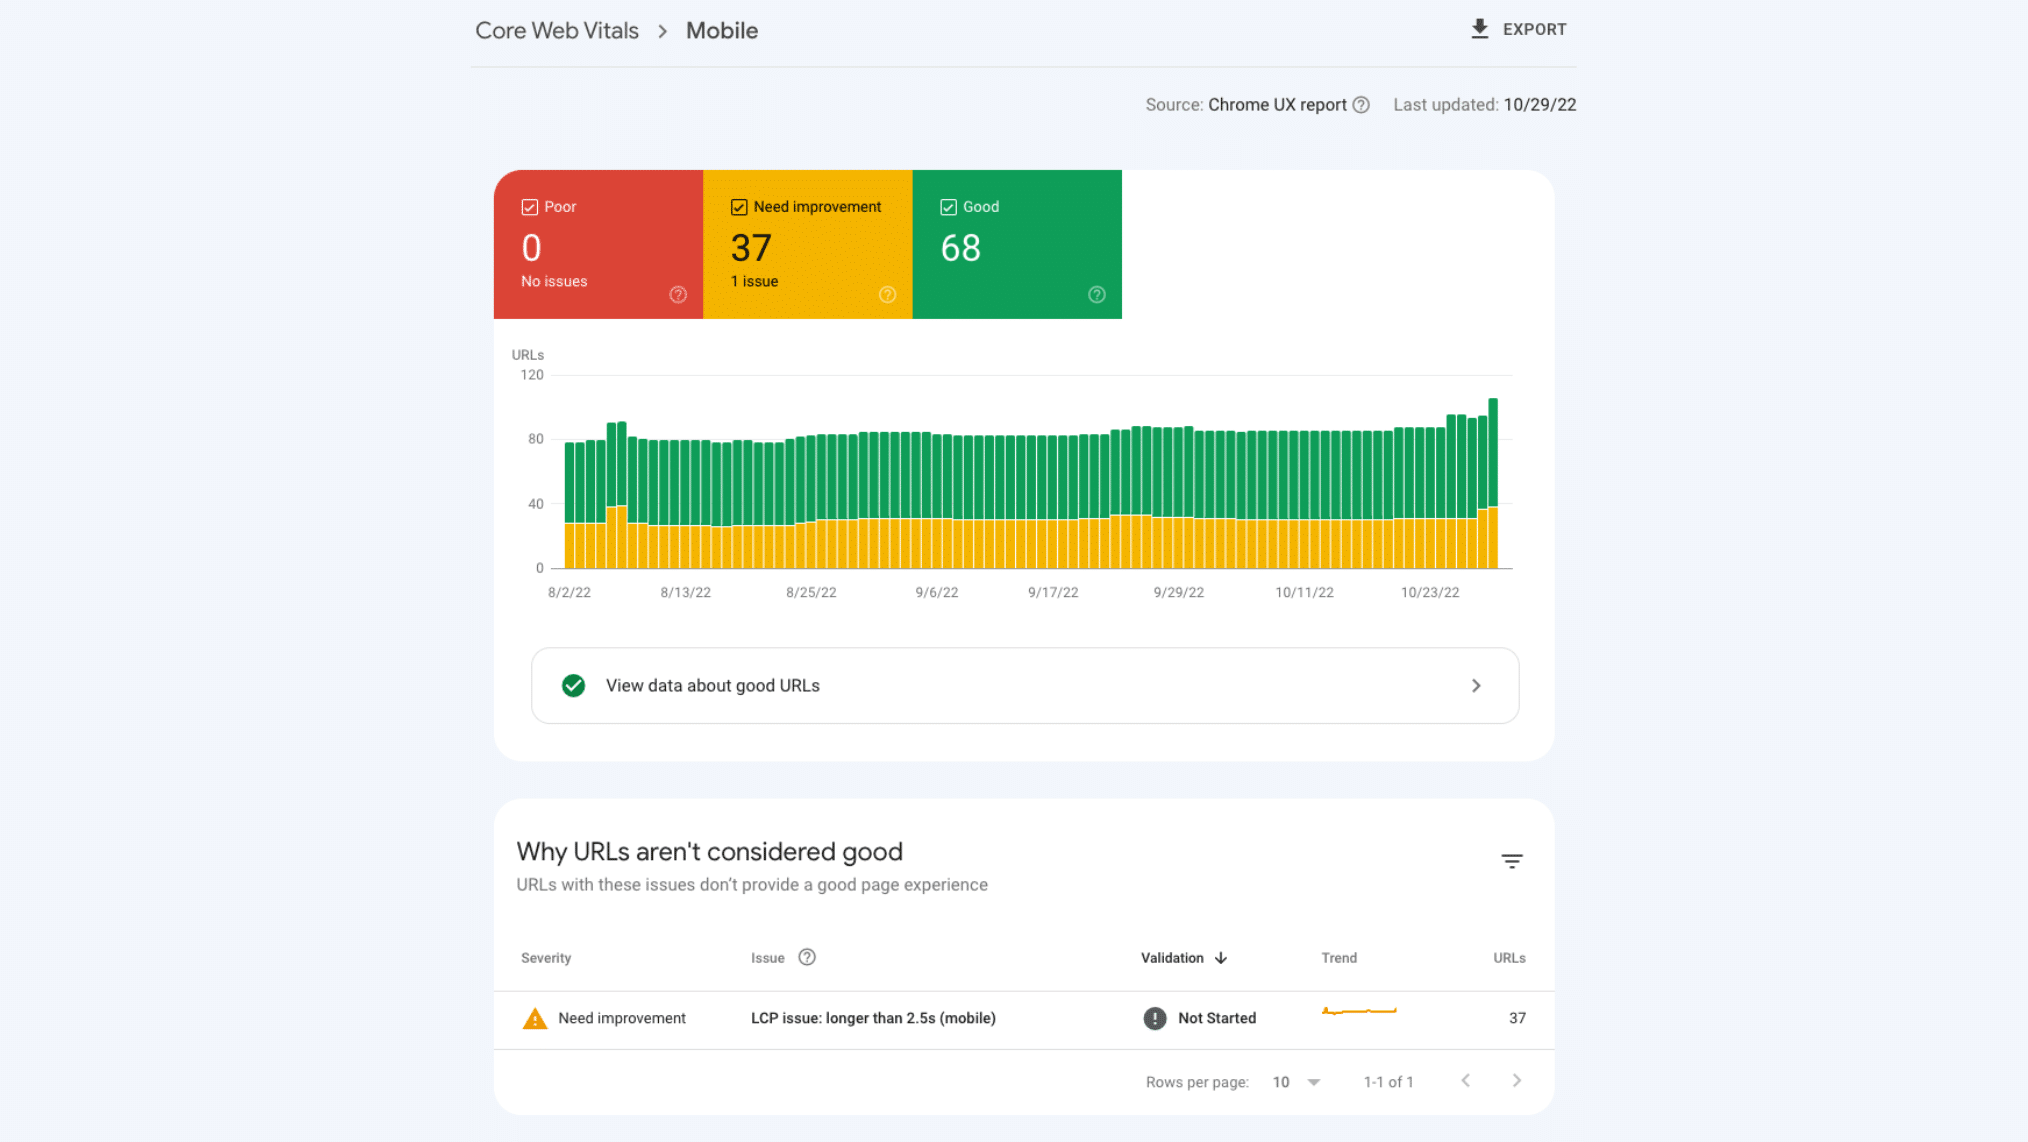
The Google Search Console Core Web Vitals report shows how your pages perform based on real user data collected from Chrome users. It groups URLs into categories like good, needs improvement, or poor, which helps you quickly identify patterns across your site.
When I review this report, I’m not just looking at scores. I’m looking at trends. If multiple pages are flagged for the same issue, it usually points to a systemic problem, such as slow server response or heavy scripts. This is often the first place I start before deciding how to optimize Core Web Vitals.
Using WebPageTest.org
WebPageTest.org allows you to run detailed performance tests from different locations, devices, and connection speeds. This is useful when you want to simulate real-world conditions beyond what basic tools provide.
In practice, I use it to dig deeper into specific issues. For example, if a page looks fine locally but performs poorly for users in another region, WebPageTest helps uncover what’s actually happening. It’s especially helpful when analyzing how Core Web Vitals page speed behaves across different environments.
Using PageSpeed Insights and Lighthouse
PageSpeed Insights and Lighthouse provide a mix of lab and field data, offering both simulated performance scores and real user experience insights. PageSpeed Insights is useful for quick checks, while Lighthouse is better suited for detailed debugging during development.
From an SEO standpoint, I treat these tools as diagnostic layers. They highlight issues such as render-blocking resources and long main-thread tasks, which often affect metrics like INP and LCP.
Field Data vs Lab Data Explained
Field data reflects how real users experience your site in actual conditions, while lab data is generated in controlled environments to help identify performance issues. Both are important, but they serve different purposes.
In real optimization work, field data is what determines whether your Core Web Vitals are actually passing, especially in reports like Google Search Console.
Lab data helps you fix problems before they impact users. If there’s a mismatch between the two, I always prioritize what real users are experiencing over what tests suggest.
How to Optimize Core Web Vitals
You optimize Core Web Vitals by removing friction across loading, interaction, and visual stability, rather than focusing on a single metric.
In most of the projects I’ve worked on, improvements come from fixing underlying technical issues like server delays, heavy scripts, and unstable layouts, not just tweaking surface-level settings.
How to Optimize Largest Contentful Paint (LCP)
You optimize Largest Contentful Paint (LCP) by ensuring your page’s main content loads as quickly as possible. This usually involves improving server performance and prioritizing critical resources so users can see meaningful content without delay.
In real-world audits, LCP issues often come from slow hosting, unoptimized images, or render-blocking files.
Reduce Server Response Time and Improve Resource Loading
Reducing server response time means your page starts loading faster, which directly improves LCP. I’ve seen noticeable gains just by moving to better hosting or enabling caching, especially for sites serving users across different regions.
At the same time, prioritizing critical resources ensures the browser loads important content first, rather than being delayed by unnecessary files.
Optimize Images and Critical Rendering Path (Read more about LCP)
Optimizing images involves compressing file sizes, using modern formats, and ensuring images are properly sized for different devices. Large, unoptimized images are one of the most common causes of slow LCP.
The critical rendering path should also be streamlined so the browser can display key content quickly without waiting for non-essential scripts or styles. Read more about LCP.
How to Optimize Interaction to Next Paint (INP)
You optimize Interaction to Next Paint (INP) by reducing delays between user interactions and visual updates. This usually comes down to how efficiently the browser handles JavaScript and processes user input.
INP issues often surface on pages that rely heavily on scripts. Even if the page loads quickly, poor interaction handling can make the site feel slow.
Reduce JavaScript Execution and Break Up Long Tasks
Reducing JavaScript execution means cutting down unnecessary code and ensuring scripts don’t block the main thread for too long. When long tasks run without interruption, the browser can’t respond to user input.
Breaking these tasks into smaller chunks keeps the browser responsive, thereby improving interaction performance.
Optimize Event Handlers and Third-Party Scripts (Read more about INP)
Optimizing event handlers ensures that clicks, taps, and inputs are processed efficiently without unnecessary delays. I often find that overly complex logic tied to interactions slows things down.
Third-party scripts, such as tracking tools or widgets, can also impact responsiveness. Auditing and deferring non-essential scripts usually leads to immediate improvements. Read more about INP.
How to Optimize Cumulative Layout Shift (CLS)
You optimize Cumulative Layout Shift (CLS) by ensuring that page elements remain stable as content loads and updates. Unexpected shifts are often caused by missing dimensions or dynamically injected content.
In practice, fixing CLS is about predictability. When users can trust that elements won’t move unexpectedly, the overall experience feels smoother.
Set Dimensions for Images and Media Elements
Setting image and media dimensions ensures the browser reserves the correct space before the content loads. Without this, elements shift as they appear, which increases CLS.
I’ve seen simple fixes, such as adding width and height attributes, significantly reduce layout instability.
Avoid Layout Shifts from Dynamic Content
Avoiding layout shifts from dynamic content means controlling how elements load and appear, especially for ads, pop-ups, or injected components. If content pushes existing elements around, users experience disruption.
Using placeholders or reserving space for dynamic elements helps maintain stability.
Common Core Web Vitals Issues and Fixes
Common Core Web Vitals issues usually come from a few recurring technical bottlenecks that affect loading speed, responsiveness, and layout stability. When I audit sites, I rarely see completely unique problems. Instead, it’s the same patterns showing up repeatedly, just implemented differently across projects.
Slow Server Response and Render-Blocking Resources
Slow server response and render-blocking resources affect how quickly a page can display its main content, which directly impacts Core Web Vitals page speed and LCP. If the server takes too long to respond, or if critical files are delayed by scripts and stylesheets, users are left waiting for anything meaningful to appear.
In most cases, I trace this back to a poor hosting setup, a lack of caching, or unoptimized resource loading. Fixing it usually involves improving server performance and ensuring that important content loads first, rather than being blocked by unnecessary files.
Heavy JavaScript and Main Thread Blocking
Heavy JavaScript and main thread blocking are two of the main reasons pages feel unresponsive, especially when users start interacting with them. Even if the page loads quickly, large scripts can slow the browser’s response to clicks, affecting metrics like INP.
From what I’ve seen, this often happens when too many scripts are loaded upfront or when complex logic runs during interactions. Reducing script size and breaking long tasks into smaller ones usually improves responsiveness without changing the visible design.
Layout Shifts from Unstable Elements
Layout shifts from unstable elements affect how visually stable a page feels as it loads and during interactions. When content suddenly moves, users can misclick or lose their place, which directly impacts CLS.
This issue typically comes from missing image dimensions or dynamically injected content that pushes existing elements around. In practical terms, reserving space for content and controlling how elements load makes the page feel much more stable and predictable.
Fix Core Web Vitals Before They Impact Performance
Core Web Vitals reflect how real users experience your site from the moment it loads until they interact with it.
If you take away anything from this guide, it’s this: understanding the core web vitals and applying a proper approach to explaining them will always put you ahead of competitors who focus only on content or rankings.
If you’re serious about figuring out how to optimize Core Web Vitals properly, it often helps to get an external perspective.
At First Page Digital, this is exactly what we do across real client projects: identifying hidden performance bottlenecks and fixing them in ways that actually impact rankings and conversions.
If you want a clearer roadmap tailored to your site, you can book a FREE strategy call worth $2000 with our team, and we’ll walk you through what’s holding your performance back and how to fix it.
Frequently Asked Questions About Core Web Vitals
What Are the Core Web Vitals?
Core Web Vitals are a set of metrics used by Google to measure how users experience a webpage in terms of loading speed, responsiveness, and visual stability. When clients ask what the core web vitals are, I usually explain it simply: it’s not just about how fast your site loads, but how smooth and usable it feels when someone actually interacts with it.
How Do Core Web Vitals Affect SEO?
Core Web Vitals affect SEO by contributing to Google’s page experience signals, which help determine how user-friendly your site is, especially when competing pages have similar content and intent. In practice, I’ve seen performance become the deciding factor in competitive niches, where faster and more stable pages tend to maintain stronger rankings over time.
Why Was FID Replaced by INP?
First Input Delay (FID) was replaced by Interaction to Next Paint (INP) because FID only measured the delay of the first interaction, which didn’t reflect overall responsiveness across a session. INP provides a more accurate view by capturing interaction delays throughout the user journey, which better reflects how a site actually performs in real-world usage.
How to Optimize Core Web Vitals?
You optimize Core Web Vitals by improving loading speed, reducing interaction delays, and stabilizing layout shifts across your pages, typically by addressing server performance, JavaScript execution, and layout behavior. In real projects, I focus on fixing the biggest bottleneck first, whether it’s LCP, INP, or CLS, because targeted improvements usually deliver faster and more meaningful results.