Core Web Vitals have shifted the way I approach technical SEO over the past few years. It’s no longer enough to just reduce your website loading speed and call it a day.
I’ve worked on projects where pages loaded quickly on paper, yet users still complained that buttons felt slow or forms lagged. That disconnect is exactly why metrics like Interaction to Next Paint (INP) matter. They go beyond load time and look at how a site actually behaves when someone tries to use it.
In this article, I’ll break down what INP really measures, why it replaced older responsiveness metrics, and how it fits into the bigger performance picture alongside LCP and CLS.
More importantly, I’ll explain it from the perspective of real audits and optimisation work. Because in practice, responsiveness isn’t theoretical. It’s the difference between a user completing a form smoothly or abandoning your site out of frustration.
What Is Interaction to Next Paint (INP)?
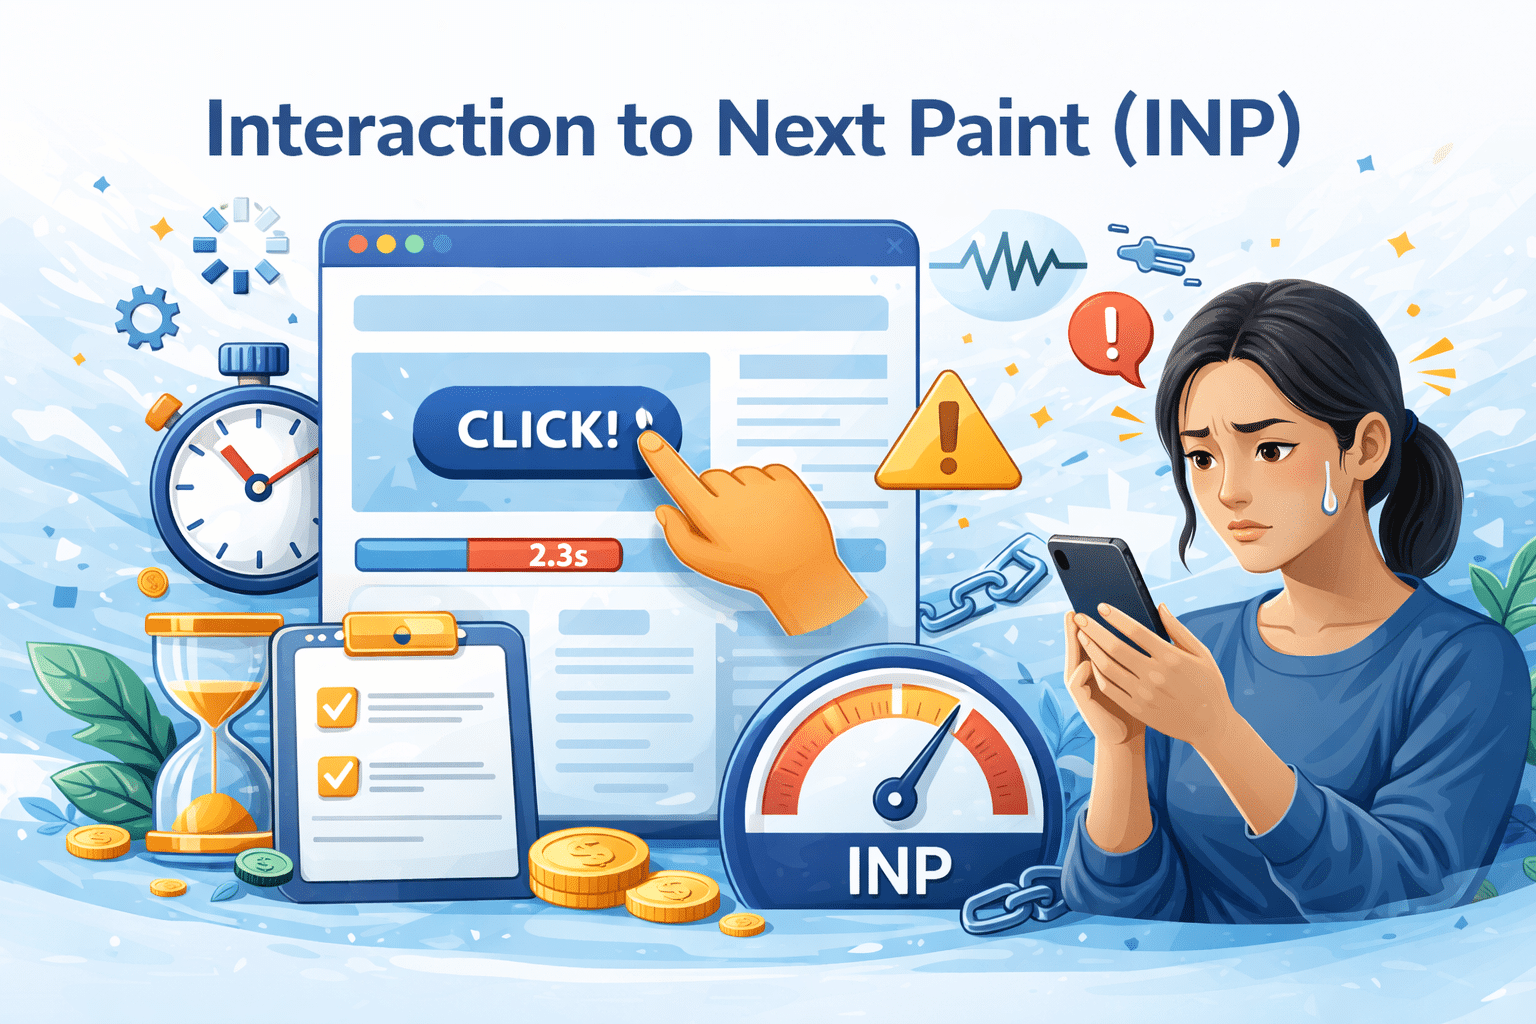
Interaction to Next Paint (INP) is a Core Web Vitals metric that measures how long a webpage takes to visually respond after a user interacts with it, such as clicking, tapping, or typing.
Unlike loading metrics like Largest Contentful Paint (LCP), INP evaluates responsiveness during actual usage. In practical terms, it shows whether your site reacts instantly when users try to engage with it.
How INP Measures Real User Responsiveness
INP measures responsiveness by tracking the latency of user interactions in real-world browsing sessions. Instead of looking at a single click, it considers multiple interactions and reports the one with the worst delay, excluding extreme outliers. This gives a more accurate picture of how a page behaves under realistic conditions.
In practice, I’ve seen pages with decent load performance but frustrating interaction delays caused by heavy scripts or long main-thread tasks. A user clicks a dropdown, and nothing happens for half a second. That delay is what INP captures. It shifts the focus from “Did the page load?” to “Does the page respond when it matters?”
Why INP Replaced First Input Delay (FID)
INP replaced First Input Delay (FID) because FID measured only the delay of the first interaction, which failed to reflect responsiveness throughout the rest of a user’s visit. A page could respond quickly to the initial click but still lag during later interactions, creating blind spots in performance evaluation, so INP now measures interaction responsiveness across the full session to better represent real user experience.
How INP Works Behind the Scenes
INP works by tracking the delay between a user’s interaction and the browser’s next visual update, focusing on real-world responsiveness rather than just load speed like LCP (Largest Contentful Paint).
While LCP measures how quickly the main content appears and highlights the importance of LCP for perceived loading performance, INP looks at what happens after the page is already visible and being used.
What Counts as an “Interaction”?
An interaction, in the context of INP, refers to a user action such as a click, tap, or key press that triggers a visual response on the page. INP does not measure passive events like scrolling or zooming; it focuses only on discrete actions that require the browser to process input and update the interface.
From the audits I’ve done, many site owners assume responsiveness only matters at page load, but that’s not accurate. Once a visitor starts engaging with filters, forms, or navigation menus, every triggered action becomes a potential interaction that INP can evaluate.
Click Interactions
Click interactions are mouse-based actions, such as clicking a button, opening a dropdown, or submitting a form. If the main thread is busy executing heavy JavaScript, that click may feel delayed, even though the page already passed LCP thresholds.
Tap Interactions
Tap interactions happen on touch devices when users press buttons, links, or UI elements. On mobile-heavy markets like Singapore, I often see tap delays caused by unoptimised scripts or excessive event listeners.
Keyboard Interactions
Keyboard interactions include actions like pressing Enter to submit a form or typing into a search bar. If the page stalls before updating suggestions or validating input, INP captures that lag.
What “Next Paint” Actually Means
“Next paint” refers to the moment the browser visually updates the screen after processing a user interaction, such as displaying a modal or updating a button state. This happens only after JavaScript execution, layout calculations, and rendering are completed, which means any long-running task that blocks these processes delays visual feedback and increases INP.
How Browsers Calculate INP
Browsers calculate INP by observing multiple user interactions during a visit and reporting the interaction with the longest delay, while excluding extreme outliers, providing a realistic measure of overall responsiveness rather than focusing on a single input event like FID.
In performance audits, this helps distinguish between pages that load quickly and those that remain responsive during continued user interaction.
What Is a Good INP Score?
A good INP score is one where users feel the page responds almost instantly to their actions, without lag or visual delay.
From an SEO and UX standpoint, responsiveness below 200 milliseconds generally feels smooth, while anything beyond 500 milliseconds starts to feel frustrating, similar to when a slow largest contentful paint makes a page look like it’s hanging before loading.
Google’s INP Performance Thresholds
Google’s INP performance thresholds define what counts as good, needs improvement, or poor based on real user responsiveness data.
I always tell clients not to treat these numbers as abstract benchmarks; they reflect actual user frustration levels, much as LCP thresholds shape how we think about LCP’s importance in perceived loading speed.
These thresholds are based on field data collected from real users, not just lab simulations. That distinction matters because what looks fine in testing can behave very differently on a mid-range Android device running multiple background apps.
Good (≤ 200 milliseconds)
A good INP score is 200 milliseconds or less, which means the page reacts quickly enough that most users won’t notice any delay. When I review performance dashboards and see sub-200ms interaction latency, I know the main thread is relatively healthy and not being blocked by heavy scripts.
Needs Improvement (200–500 milliseconds)
An INP score between 200 and 500 milliseconds indicates users will start to feel slight hesitation, especially during repeated interactions such as filtering products or submitting forms. In e-commerce projects I’ve worked on, this is often where JavaScript bundles or third-party scripts quietly slow things down.
Poor (≥ 500 milliseconds)
An INP score above 500 milliseconds signals a serious responsiveness issue that users can clearly feel. At this point, the delay is no longer subtle; the interface appears unresponsive, and that erodes trust quickly, similar to when a slow largest contentful paint makes visitors think the page is broken.
Why Field Data Carries More Weight Than Lab Data
Field data carries more weight than lab data because it reflects how real users experience responsiveness across actual devices, network conditions, and usage patterns rather than controlled testing environments. While lab tools help diagnose technical issues, real user monitoring ultimately determines whether interaction improvements genuinely reduce INP in production.
Why INP Matters for SEO and User Experience
INP matters for SEO and user experience because it measures how quickly your site reacts when someone actually tries to use it.
I’ve seen pages with decent LCP and technically acceptable largest contentful paint scores still frustrate users simply because buttons lag or forms freeze, and that’s where INP exposes the real problem.
How INP Affects Perceived Performance
INP affects perceived performance by shaping how “responsive” a site feels after it loads. A page can appear visually ready, but if a user clicks a filter and nothing happens for half a second, the experience immediately feels slow. That split-second hesitation creates doubt.
From my audits, users don’t consciously think about metrics like LCP or INP; they just decide whether the site feels smooth. When interaction delays stack up — opening menus, submitting forms, switching tabs — the brand starts to feel unreliable. Perception shifts fast, even if your load speed metrics look acceptable on paper.
The Relationship Between INP and Core Web Vitals Ranking Signals
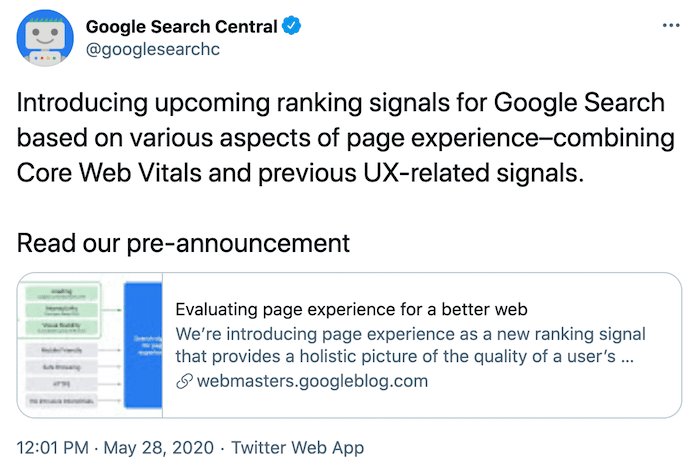
INP is part of Core Web Vitals, which means it contributes to Google’s overall page experience evaluation. While content relevance still drives rankings, technical performance signals like INP, LCP, and CLS support that foundation. I treat them as indicators of trust rather than magic ranking boosters.
If your competitors publish content of similar quality but your site responds faster to user interactions, you reduce friction.
Over time, that smoother experience can support stronger engagement metrics. Just as the importance of LCP lies in making a page feel useful quickly, INP ensures it remains usable once interaction begins.
Business Impact of Poor Responsiveness
Poor responsiveness directly impacts conversions, especially on transactional pages. When a checkout button lags, or a lead form hesitates after submission, hesitation creeps in. I’ve reviewed funnel recordings where users double-click out of frustration, sometimes triggering duplicate requests or abandoning entirely.
From a commercial standpoint, fixing responsiveness is as critical as learning how to reduce LCP. One improves first impressions; the other protects user actions. If your site loads fast but reacts slowly, you’re only solving half the problem. And users will notice.
Common Causes of Poor INP Scores
Poor INP scores usually happen when the browser is too busy to respond quickly to user interactions. In my experience auditing client sites, the issue rarely comes from one single flaw. It’s often a combination of heavy scripts, blocked main threads, and delayed visual updates, all happening at the exact moment a user clicks something.
Long Main Thread Tasks
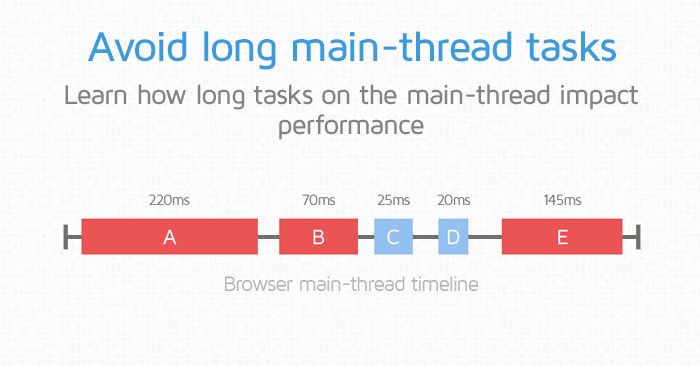
Long main thread tasks block the browser from responding to user input. When a script runs for several hundred milliseconds without yielding, the browser simply cannot process a click or tap in between. I’ve seen this happen frequently on marketing-heavy pages where large bundles execute immediately after load.
For example, imagine a user clicks a “Book Demo” button while a complex animation script is still running. The interaction waits in the queue. That delay directly increases INP because the next paint can’t happen until the task completes. Breaking these tasks into smaller chunks is often the first fix I recommend.
Heavy JavaScript Execution
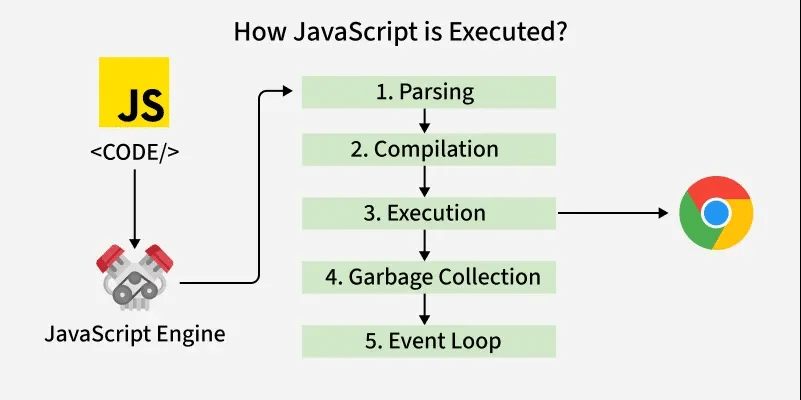
Heavy JavaScript execution slows interaction responsiveness because the browser must parse, compile, and execute code before updating the screen. Modern frameworks are powerful, but without optimisation, they inflate interaction costs.
In one audit, a client had multiple unused components loading on every page. The site passed the LCP thresholds, yet interaction lag remained high.
Reducing bundle size and deferring non-critical scripts improved responsiveness almost immediately. Just like understanding how to reduce LCP requires trimming render-blocking resources, improving INP often starts with cutting JavaScript weight.
Event Handler Delays
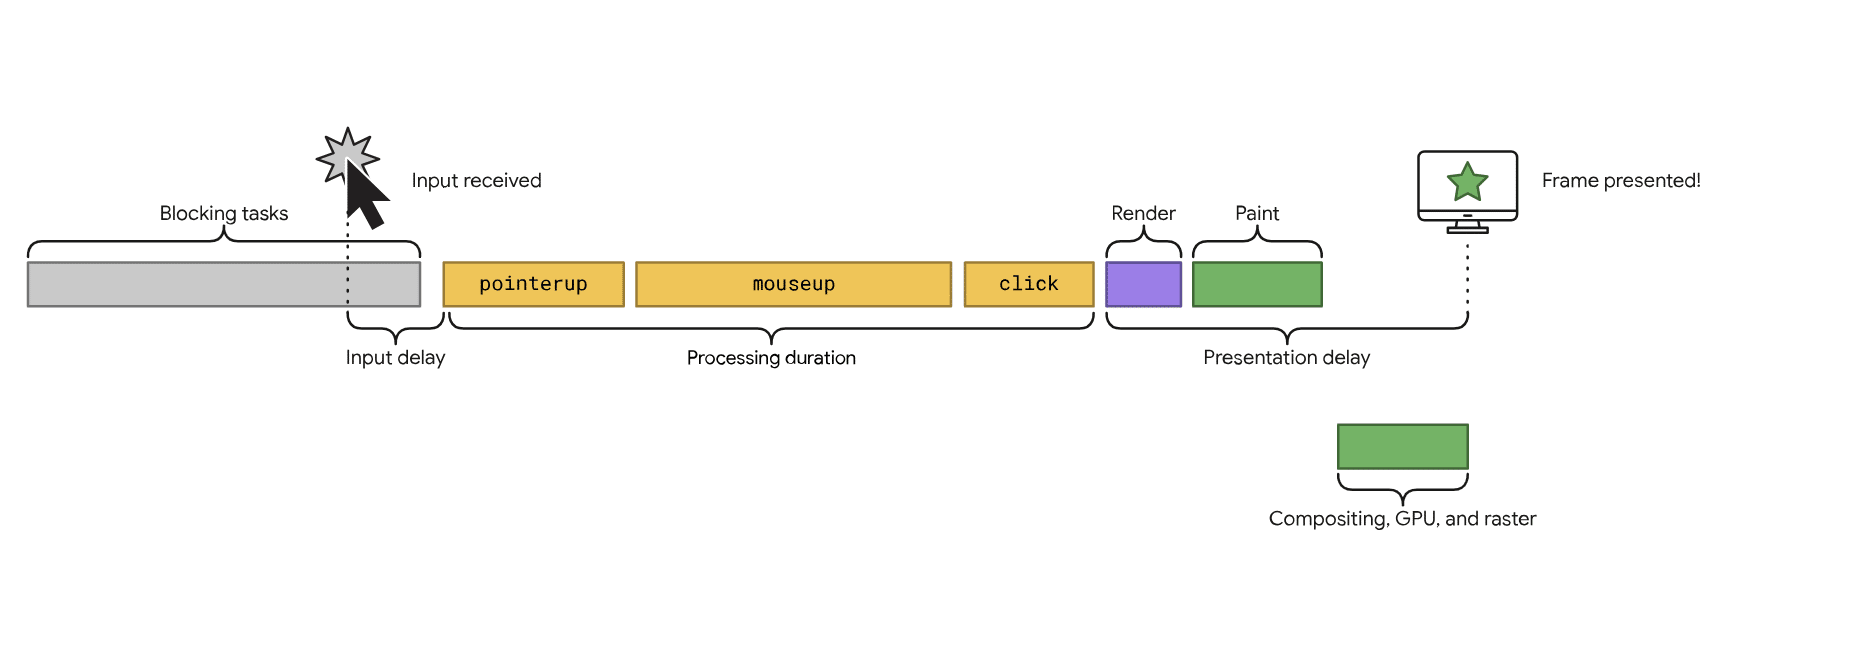
Event handler delays occur when the function tied to a click or tap takes too long to execute. The user interacts, but the code behind that interaction runs complex logic before allowing the page to repaint.
I’ve reviewed cases where form submissions triggered synchronous validation, analytics calls, and UI updates all at once. Instead of instant feedback, users experienced a visible pause. Separating critical UI updates from background processes can significantly reduce that delay.
Third-Party Scripts and Tag Managers
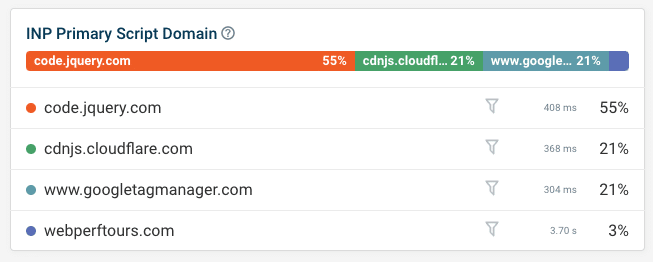
Third-party scripts and tag managers commonly inflate INP because they introduce additional processing during interactions. Marketing pixels, chat widgets, A/B testing tools — each one competes for main thread time.
The challenge is that these tools often feel “necessary” to stakeholders. I usually advise prioritising performance impact. If a script fires on every click event, it directly affects responsiveness. Auditing and deferring non-essential scripts can stabilise interaction timing without sacrificing tracking entirely.
Layout Shifts Triggered During Interaction
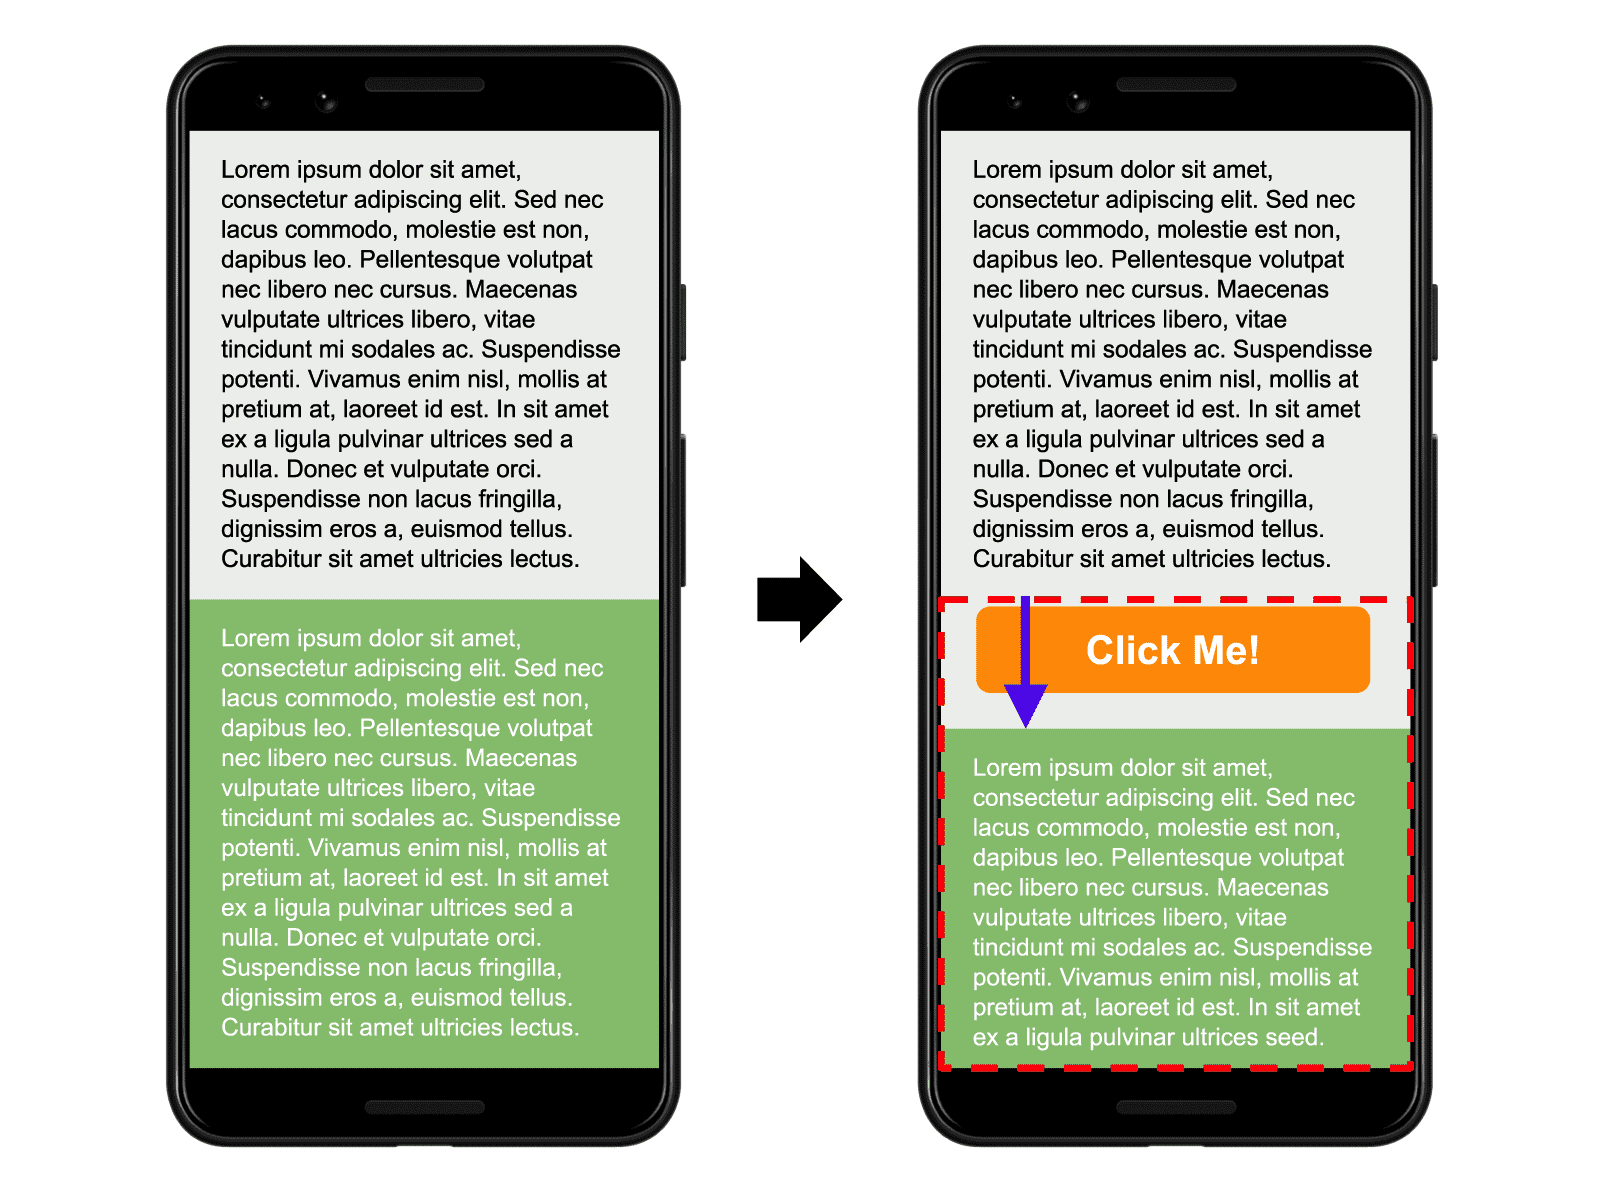
Layout shifts during interaction hurt INP by delaying the visual update users expect after input. When a click causes unexpected reflows or DOM recalculations, the browser must re-render more than it intended to.
Although layout stability is often discussed under CLS, I’ve seen interaction-triggered shifts increase responsiveness delays, too.
A dropdown that pushes content downward or dynamically loads images without reserved space forces extra work before the next paint. Minimising layout recalculations keeps interactions feeling immediate and controlled.
How to Measure and Monitor INP
You measure and monitor INP by looking at both real user data and controlled lab testing data, because each tells a different story about responsiveness.
In my audits, I never rely on just one source. Field data shows what actual users experience, while lab tools help isolate technical bottlenecks before they affect rankings or conversions.
In the Field
You measure INP in the field by analysing real user interactions collected from actual visitors. This data reflects real devices, real network speeds, and real behaviour patterns — not just ideal test conditions. For SEO performance, this is the data that ultimately matters.
Monitoring INP in Real User Monitoring (RUM) Tools
RUM tools track interactions from real sessions and surface slow clicks, taps, and key presses. When I review these dashboards, I’m looking for patterns—are delays happening only on mobile or across all devices? That context helps prioritise fixes properly, rather than guessing.
Measuring INP in PageSpeed Insights (CrUX Data)
PageSpeed Insights shows INP data sourced from the Chrome UX Report field data when sufficient traffic is available. I use this to quickly confirm whether Google sees the page as “good,” “needs improvement,” or “poor” from a real-world perspective. If your INP fails here, it’s a ranking and UX signal you shouldn’t ignore.
Using Performance Monitoring Platforms (e.g., DebugBear)
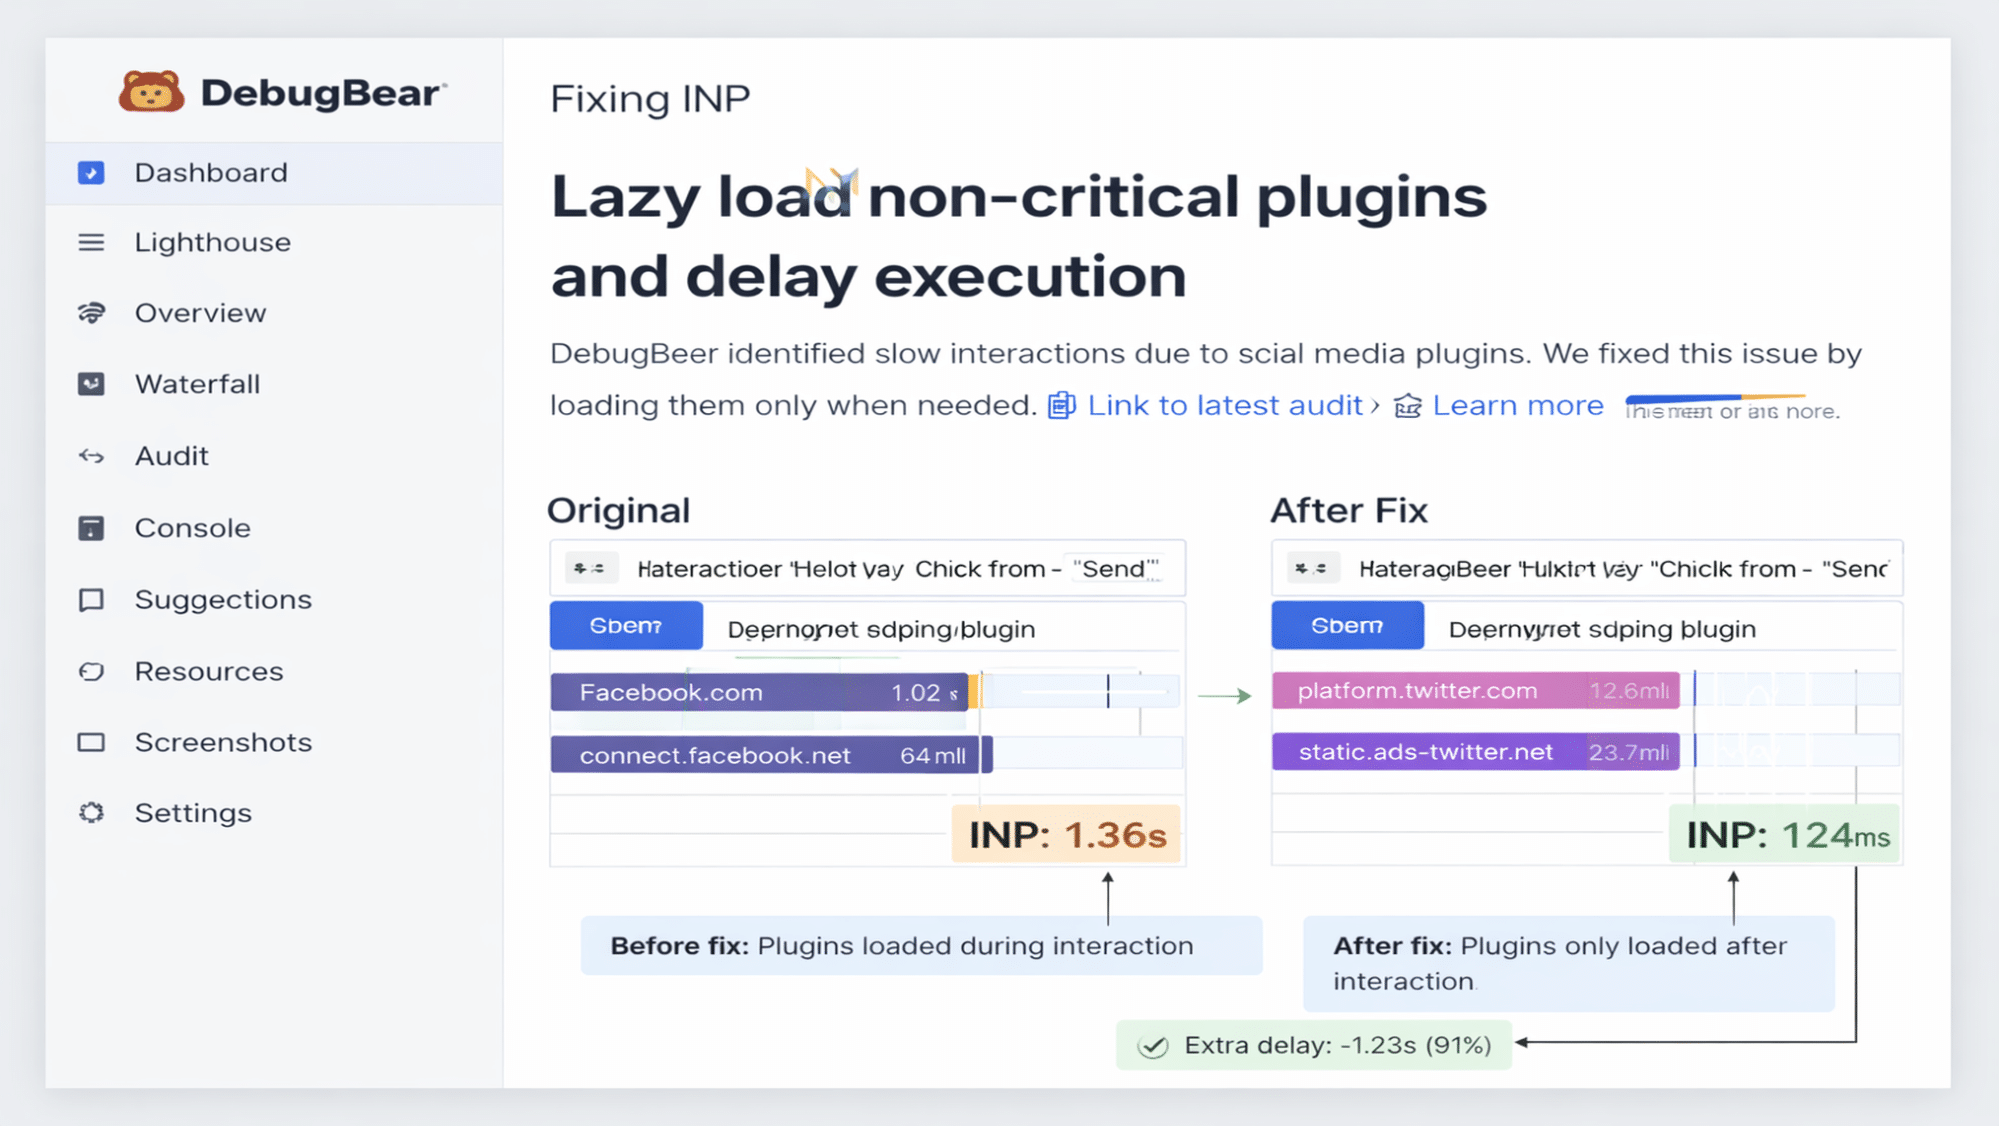
DebugBear dashboard showing how fixing scripts improves Interaction to Next Paint INP performance
Performance monitoring platforms like DebugBear provide session-level visibility into what’s blocking interactions. I’ve used it to trace long tasks and blocking scripts tied to specific user clicks. Instead of generic recommendations, you get actionable breakdowns — which script, how long it blocked, and where optimisation will reduce delays.
In the Lab
You measure INP in the lab by simulating user interactions in controlled environments. Lab testing doesn’t replace field data, but it allows you to diagnose problems before they impact real users. I treat lab tools as diagnostic instruments, not final verdicts.
Measuring INP in Chrome DevTools
Chrome DevTools lets you record interactions and inspect long-running tasks on the main thread. When I run performance recordings, I look for blocking scripts around input events. If a click triggers a 400ms task, that’s immediately visible in the performance timeline.
Using Lighthouse to Identify Interaction Delays
Lighthouse simulates interactions and highlights responsiveness issues in a structured report. While it doesn’t capture the full range of real-world variability, it’s useful during development and pre-launch testing. I often use it to catch JavaScript bottlenecks early, especially on newly deployed pages.
Measure INP in JavaScript
You can measure INP in JavaScript by using the PerformanceObserver API to capture interaction timing data directly in the browser. This approach is more technical, but it gives developers granular control over how responsiveness metrics are collected and analysed.
Differences Between the Metric and the API
The INP metric reported by Google aggregates interaction latency across a session, while the API exposes raw interaction timing entries.
In practice, this means what you collect via JavaScript may not exactly match the final INP score shown in reporting tools. I always clarify this with development teams so expectations are aligned — the API helps diagnose, but Google’s aggregated metric determines evaluation.
How to Improve INP (Step-by-Step)
You improve INP by reducing the time the browser is blocked from responding to user interactions, especially on the main thread. In most of the technical SEO audits I run, poor responsiveness stems from JavaScript overload, inefficient rendering, or scripts competing for priority. Fixing INP isn’t about one tweak — it’s about systematically removing friction from how the page processes interactions.
Reduce JavaScript Execution Time
You reduce JavaScript execution time by cutting down the amount of code the browser has to parse, compile, and run before it can respond to a click or tap.
In real projects, this often means removing unused libraries, splitting bundles, or delaying non-critical scripts. I’ve seen pages where a single heavy plugin added hundreds of milliseconds of blocking time. And once removed, INP improved almost immediately.
Sometimes the issue isn’t volume but timing. If large scripts are loaded and executed during user interaction, responsiveness drops. I usually work with developers to lazy-load features that aren’t needed on first interaction. That small structural change can make a noticeable difference.
Break Up Long Tasks
You break up long tasks by ensuring no single piece of JavaScript blocks the main thread for too long. When a task runs for 300–500 milliseconds without yielding, the browser can’t respond to input. That’s where INP suffers.
In practice, I recommend chunking heavy computations into smaller asynchronous tasks. Using techniques like requestIdleCallback or splitting loops prevents the browser from freezing during interactions. It’s not glamorous work, but it directly improves responsiveness metrics.
Optimise Event Handlers
You optimise event handlers by making sure click, tap, and keyboard listeners execute efficiently and avoid unnecessary processing. If a button triggers multiple expensive DOM operations or layout recalculations, the delay becomes visible to users.
When reviewing code, I look for redundant listeners and synchronous logic tied to input events. Often, simply deferring non-essential updates until after the paint cycle helps. The goal is straightforward: respond first, calculate later.
Defer or Remove Unnecessary Third-Party Scripts
You defer or remove unnecessary third-party scripts by evaluating whether every tracking tag, widget, or external integration is actually needed. I’ve audited sites with 20+ third-party scripts loading on initial interaction. Each one competes for the main thread time.
From an SEO and performance perspective, every external script should justify its existence. If it doesn’t contribute directly to revenue or measurement, it shouldn’t delay user responsiveness. Deferring non-critical tags until after user interaction stabilises is usually a smart compromise.
Use Efficient Rendering Strategies
You use efficient rendering strategies by minimising layout recalculations and avoiding unnecessary DOM updates during interactions. If clicking a button triggers a full-page reflow, INP will reflect that delay.
In optimisation projects, I often recommend isolating dynamic components, reducing layout thrashing, and ensuring CSS changes don’t trigger expensive re-renders. Performance improvements here don’t just help INP.
They also reinforce the overall importance of LCP and largest contentful paint optimisation. When rendering is efficient, both visual load time and responsiveness improve together, strengthening your Core Web Vitals profile as a whole.
INP vs Other Core Web Vitals
INP differs from other Core Web Vitals because it measures responsiveness after a user interacts, while the others focus on loading speed and visual stability. In my audits, I treat INP, LCP, and CLS as three parts of the same performance story: how fast your page loads, how stable it looks, and how quickly it reacts when someone clicks.
INP vs Largest Contentful Paint (LCP)
INP measures interaction responsiveness, while LCP measures how quickly the largest visible element loads. LCP focuses on the loading phase and reflects how quickly users perceive the page to load. That’s why understanding the importance of LCP is critical; if your largest contentful paint is slow, users may leave before they even interact.
However, a good LCP score doesn’t guarantee good responsiveness. I’ve seen websites with excellent LCP metrics but frustrating delays when users click a filter or open a menu. That’s where INP comes in. If LCP is about first impressions, INP is about ongoing usability.
INP vs Cumulative Layout Shift (CLS)
INP tracks how fast the page responds to input, while CLS measures how stable the layout remains during loading and interaction. CLS protects users from unexpected shifts. Think of buttons moving just as they try to click them.
In real-world optimisation work, these two can overlap. For example, if an interaction triggers layout shifts, both CLS and INP may worsen. A slow event handler combined with layout instability creates a double hit to user experience.
How All Three Metrics Work Together
All three metrics work together to define real user experience across loading, stability, and responsiveness. LCP ensures users see meaningful content quickly, CLS ensures it doesn’t jump around, and INP ensures the page reacts instantly when they engage.
From an SEO standpoint, I never optimise these metrics in isolation. Improving LCP reduction without accounting for interaction delays can still leave users frustrated. When loading speed, layout stability, and responsiveness are aligned, that’s when performance genuinely supports both rankings and business outcomes.
Fix Responsiveness Before It Hurts Rankings
INP isn’t just another technical metric to tick off a checklist. It reflects whether your site actually responds when real people click, tap, or type.
After more than 5 years working in SEO, I’ve learned that performance issues rarely occur in isolation. A site might pass LCP and still feel frustrating because interaction delays quietly erode trust. When responsiveness suffers, engagement drops, conversions weaken, and over time, that can affect how competitive your pages are in search.
If you’re serious about performance, don’t wait for rankings to slip before paying attention to INP.
Start by reviewing real user data, identifying what’s blocking the main thread, and prioritising fixes that remove friction from key interactions. Loading speed gets users through the door; responsiveness keeps them there.
Frequently Asked Questions About INP
Why is INP important for SEO?
INP is important for SEO because it reflects how responsive your page feels to real users. If someone clicks a button and nothing happens for half a second, that delay creates frustration — even if your LCP is strong. Google’s Core Web Vitals aim to measure real experience, and responsiveness is a key part of that.
From my experience, poor INP often correlates with lower engagement metrics. Users bounce faster when a site feels sluggish, and that behavioural signal can indirectly affect performance over time.
Is INP a Ranking Factor?
Yes, INP is part of Core Web Vitals, which are used as ranking signals. It doesn’t outweigh content relevance or authority, but when two pages are otherwise similar, performance can influence which one ranks higher.
I treat INP as a competitive advantage metric. It won’t save weak content, but it can strengthen strong content.
Does INP Affect All Pages Equally?
No, INP affects pages differently depending on how interactive they are. A simple blog article may have fewer interaction points compared to a web app or e-commerce filter page.
That said, any page with forms, menus, buttons, or dynamic elements can suffer if responsiveness isn’t optimised.
How Often Should You Monitor INP?
You should monitor INP continuously, especially after deploying design changes or new scripts. Even small frontend updates can introduce blocking JavaScript that slows interactions.
For most businesses, a monthly review is the minimum. High-traffic or transactional sites should track it weekly.
What causes poor INP performance?
Poor INP performance is usually caused by heavy JavaScript, long main-thread tasks, and delayed event handlers. When the browser is busy executing scripts, it can’t respond instantly to user input.
Third-party tags and poorly optimised interaction logic are also common culprits in real-world audits.
How to fix the Interaction to Next Paint (INP) issues?
You fix INP issues by reducing JavaScript execution time, breaking up long tasks, and optimising how interactions are handled. Removing unnecessary third-party scripts often makes a noticeable difference.
Start by identifying slow interactions in field data, then prioritise the ones that impact real users most. Fix what blocks responsiveness first — that’s where the biggest gains usually are.